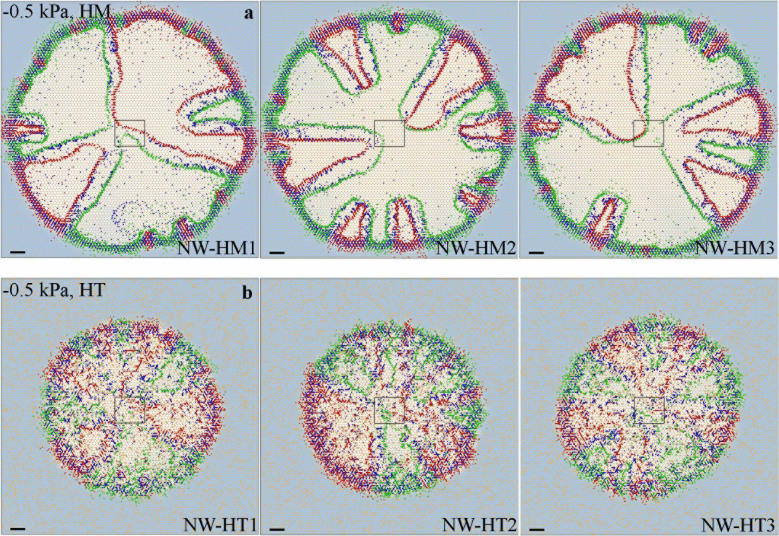
Figure 2. Simulated microbial spatial patterns on homogeneous and heterogeneous rough surfaces.
Simulated spatial patterns of microbial consortium II on (a) homogeneous (HM) and (b) heterogeneous (HT) surfaces at −0.5 kPa, at 50 h after inoculation, on three newly generated networks [network-1 (NW-HM1 and NW-HT1), network-2 (NW-HM2 and NW-HT2) and network-3 (NW-HM3 and NW-HT3)]. Red, green and blue spots represent individual cells of sp1, sp2 and sp3, respectively. Light blue background marks normalized concentration of N1 (white area means N1 was depleted). Squares mark original inoculation positions. The scale bar is 1 mm.

