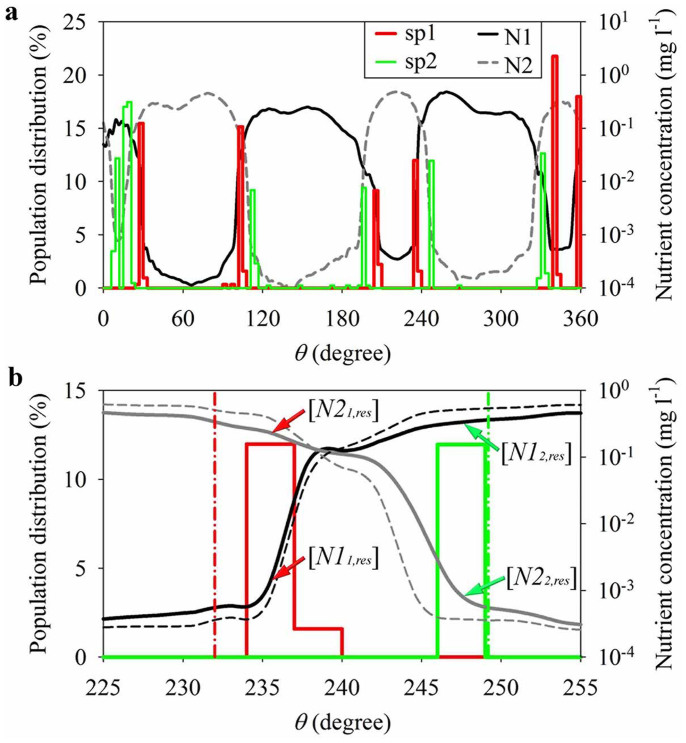
Figure 3. Angular distributions of microbial population fraction and associating nutrient concentrations forming during self-assembly of simulated consortia patterns.
(a) Angular distributions of populations sp1 and sp2 and nutrient concentrations N1 and N2 at 50 h after inoculation at the region marked by dash-circles (also definition of θ) in Fig. 1b; and (b) a zoom-in image of panel (a) with θ ranges from 225 to 255 degree (solid black and gray curves mark nutrient concentrations of N1 and N2 at 50 h after inoculation, and dash curves for 35 h), and dash-dot lines mark the theoretical positions with the ratio of [N1i,res] to [N2i,res] of 0.0015 (0.0062 for simulation, marked by red arrows) for sp1 (red), and 672 (412 for simulation, marked by green arrows) for sp2 (green).

