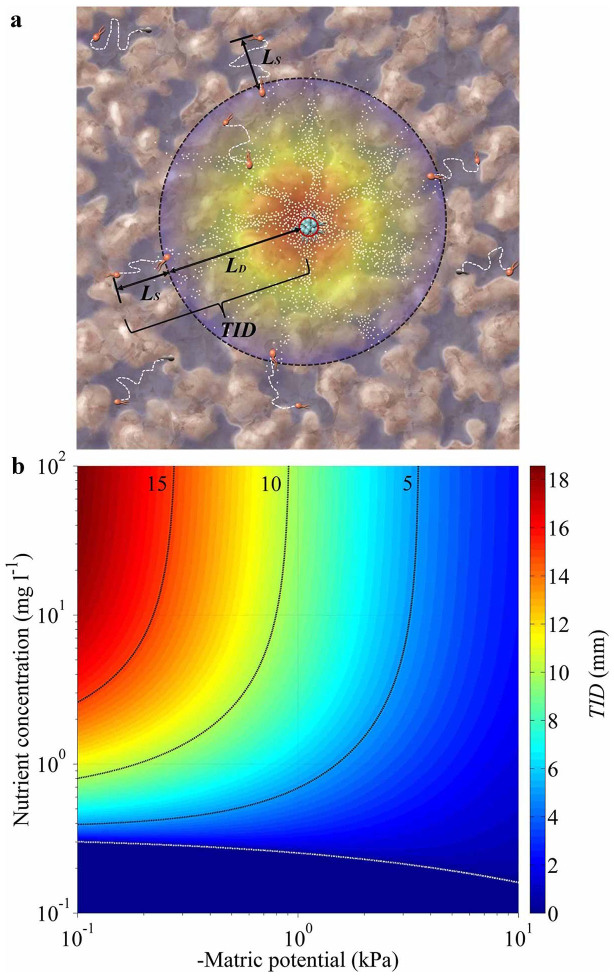
Figure 4. Analytical predictions of microbial Trophic Interactions Distance (TID) for the onset of consortium self-assembly.
(a) A schematic of the biophysical parameter TID and its two components of LS and LD, see equations (S10) and (S12), dark dash-circle [or white dash-line in panel (b)] marks threshold concentration of by-product (gray dots with red-yellow-blue colors representing concentration gradient, and red circle marks initial nutrient source) excreted by producer species (light-blue rods) supporting maintenance of consumer species (red rods, white dashed lines marking cell motion trajectories) and triggering trophic interactions and subsequent consortia self-assembly (faded rods mark consumer cells beyond the TID range), and dark-blue in the background mark water configuration; and (b) analytically-derived TID values at various hydration (expressed as water matric potential value) and nutrient conditions.

