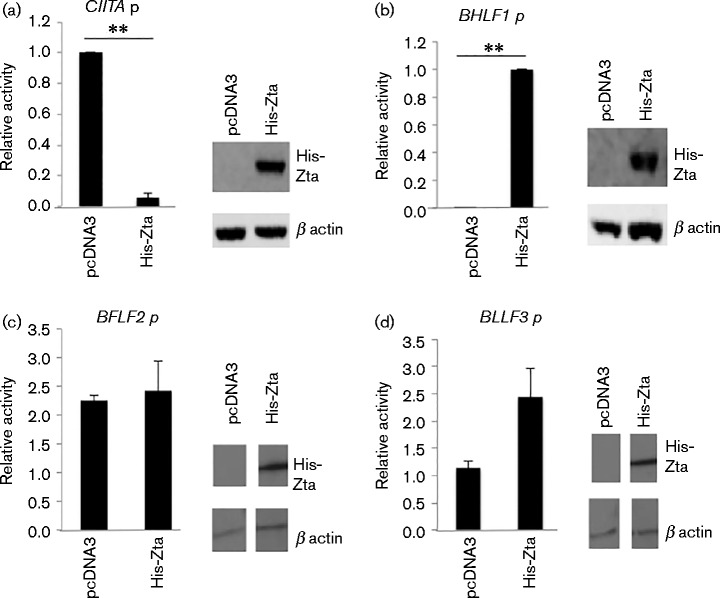
Fig. 1.
Repression of CIITA promoter by Zta is specific. (a–d) The CIITA ( − 286 to +54) (a), BHLF1 (b), BFLF2 (c) and BLLF3 (d) promoter-luciferase plasmids and the indicated expression vectors were introduced into cells by electroporation, and 48 h later cells were harvested and the luciferase activity determined. Promoter activity in Raji cells relative to the maximal activity of CIITA promoter (transfected with control plasmid) with the standard deviation from six assays (three replicate samples from each of two separate experiments) is shown. For comparisons +/ − Zta, ** represents p of significant difference < 0.01. The expression of His-Zta and endogenous protein were analysed by Western blot of proteins from the transfected cells.

