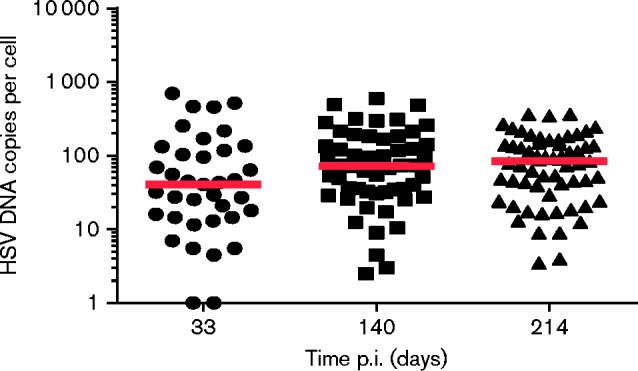
Fig. 2.

Single cell latent viral DNA loads. Dot plot representation of single cell latent DNA loads from three (1 per time point) mice killed at 33, 140 and 214 days p.i. Each dot represents DNA loads within a cell and the floating red bar represents the median of these data at each time point.
