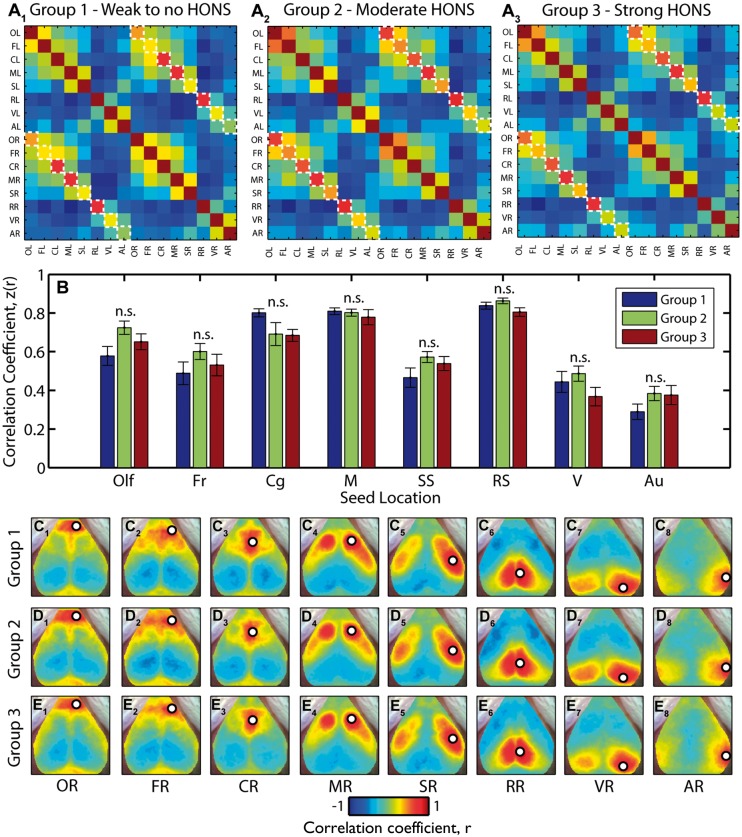
Figure 7.
Functional connectivity brain networks across groups are not affected in mice with HONS. (A) Seed–seed correlation matrices for the three groups indicated in Figure 5. The results were generated after filtering ΔHbO2 data within the RSFC band. Contralateral homotopic functional connectivity values are marked with a white dashed line. (B) Z-scores for contralateral homotopic functional connectivity values for eight seeds for all three groups. There is no statistically significant difference in contralateral homotopic functional connectivity values across the three groups. Multiple comparisons corrected for using Benjamini and Hochberg’s FDR-controlling procedure (α = 0.05). (C) Correlation maps for right olfactory bulb (C1), frontal (C2), cingulate (C3), motor (C4), somatosensory (C5), retrosplenial (C6), visual (C7), and auditory (C8) cortices for blocks in group 1. (D) Same as C but for group 2. (E) Same as C but for group 3.

