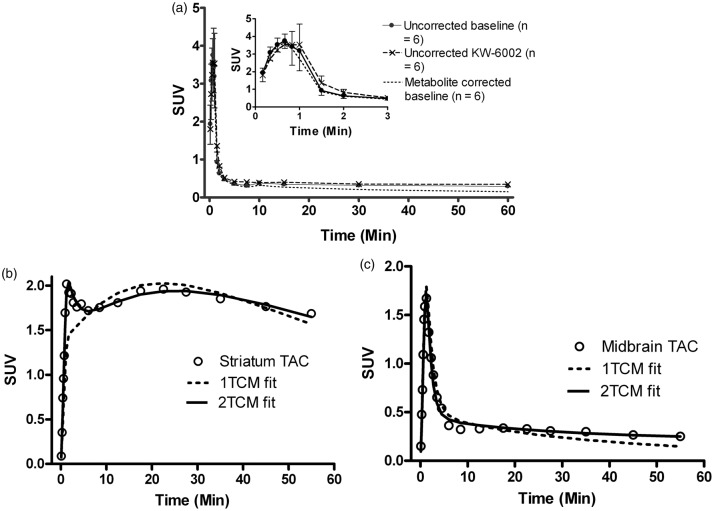
Figure 1.
(a) Kinetics of [11C]preladenant in rat plasma. The insert shows the first 3 min of the plasma kinetics. Error bars indicate standard deviation. (b, c) Representative TACs and modeling fits of individual brain regions at baseline. (b) TAC of striatum with 1TCM and 2TCM fits with a fixed blood volume of 5%. (c) TAC of midbrain with 1TCM and 2TCM fits with a fixed blood volume of 5%.
TACs: time-activity curves; 1TCM: one-tissue compartment model; 2TCM: two-tissue compartment model.

