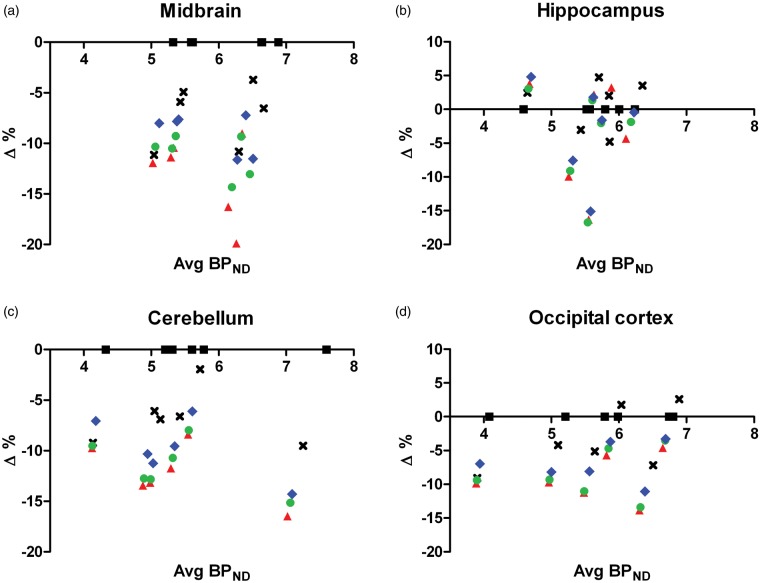
Figure 2.
Bland–Altman plot for midbrain (a), hippocampus (b), cerebellum (c), and occipital cortex (d) with different modeling methods to obtain striatal BPND. , , where BPND,1 was derived from 2TCM (black square), Logan plot (black cross), SRTM (red triangle), MRTM (green circle), and RLogan (blue diamond), and BPND,2 was always calculated from 2TCM. Each point represents the data of an individual animal (n = 6). BPND obtained from 2TCM and Logan plot was calculated from the VT using the formula .
2TCM: two-tissue compartment model; SRTM: simplified reference tissue model; MRTM: multilinear reference tissue model; RLogan: reference tissue Logan plot.

