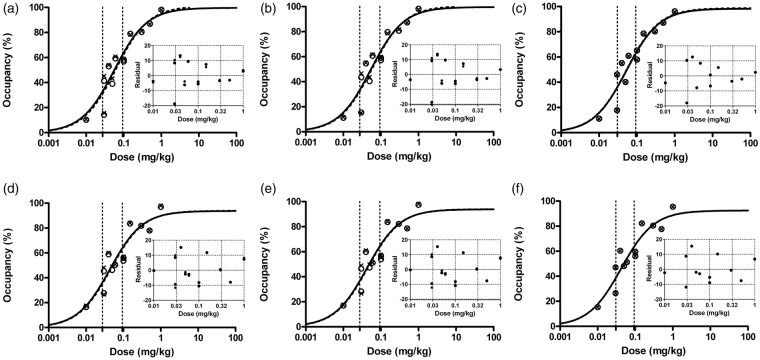
Figure 5.
Striatal A2AR occupancy against KW-6002 doses. (a–c) Occupancy was determined by SRTM (a), RLogan (b), and mSUVr – 1 (c), using midbrain as the reference region. (d–f) Occupancy was determined by SRTM (d), RLogan (e), and mSUVr – 1 (f), using occipital cortex as the reference region. (a, b, d, e) Circle: occupancy for 60-min acquisition; Cross: occupancy for 90-min acquisition; Curved dotted line: 60-min acquisition fit; Solid line: 90-min acquisition fit. (c, f) Circle: occupancy for mSUVr – 1, based on RLogan correction; Cross: occupancy for mSUVr – 1, based on SRTM correction; Curved dotted line: RLogan corrected mSUVr – 1 fit, Solid line: SRTM corrected mSUVr – 1 fit. The areas between vertical dotted lines represent 95% confidence interval of ED50. The inserts indicate residuals of regression. Correction factors for mSUVr – 1 were determined by Deming linear regression between SUVr – 1 and SRTM or RLogan derived BPND.
A2AR: A2A receptor; SRTM: simplified reference tissue model; RLogan: reference tissue Logan plot.

