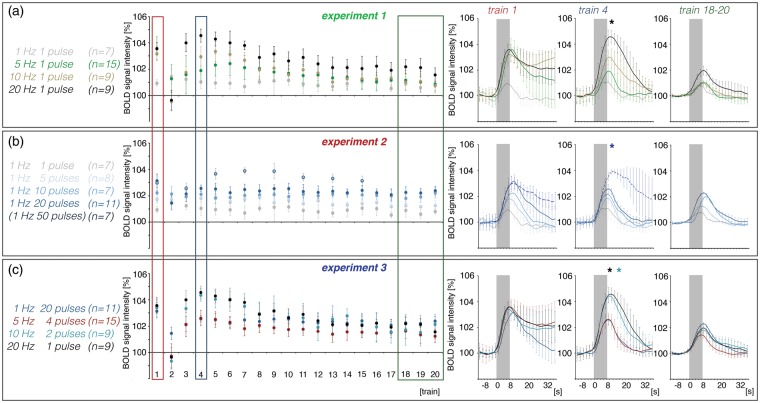
Figure 2.
Summary of the measured BOLD responses in the right hippocampus during electrical stimulation of the right perforant pathway. Here, averaged maximal BOLD signal intensities during each BOLD response measured in experiment 1 (a), experiment 2 (b), and experiment 3 (c) are depicted. The averaged BOLD response during the first, fourth, and 18th–20th stimulation trains are summarized on the right. Asterisks indicate significantly increased BOLD response during train 4 when compared with train 1 (black: 20 Hz-1-pulse, dark blue: 1 Hz-50-pulse, turquoise: 10 Hz-2-pulse).

