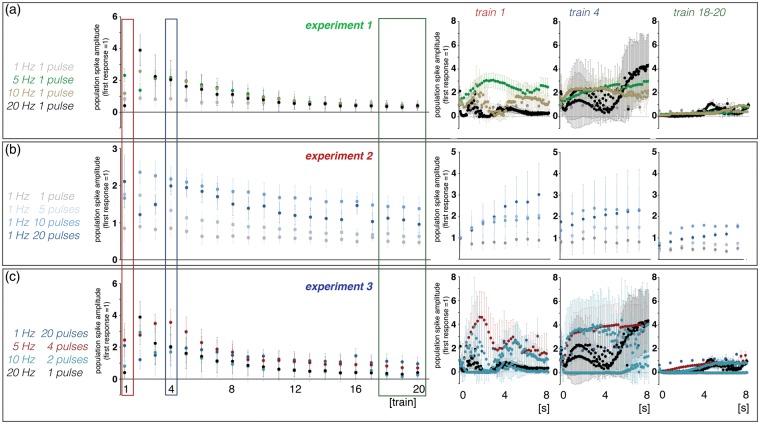
Figure 3.
Summary of the electrophysiological responses in the right dentate gyrus during electrical stimulation of the right perforant pathway. Here, averaged population spike amplitudes during individual stimulus trains recorded in experiment 1 (a), experiment 2 (b), and experiment 3 (c) are depicted. The development of individual population spike amplitudes during the first, fourth, and 18th–20th stimulation trains are summarized on the right.

