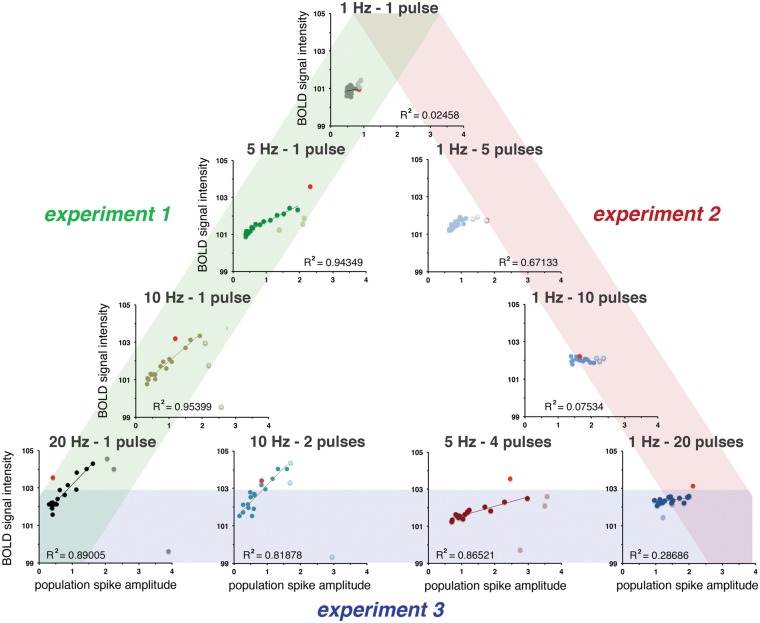
Figure 5.
The relation between spiking activity (i.e. averaged population spike amplitude, see Figure 3) and the resultant BOLD response (see Figure 2) depends on the applied stimulation pattern. Strong correlations between these two factors were only found after an initial default-like BOLD response (i.e. induced by the first stimulation train, red dot) and followed by a short period of functional reconfiguration (train 2–4, pale dots). During stimulation with ≥ 10 high-frequency burst pulses, this correlation is nonexistent.

