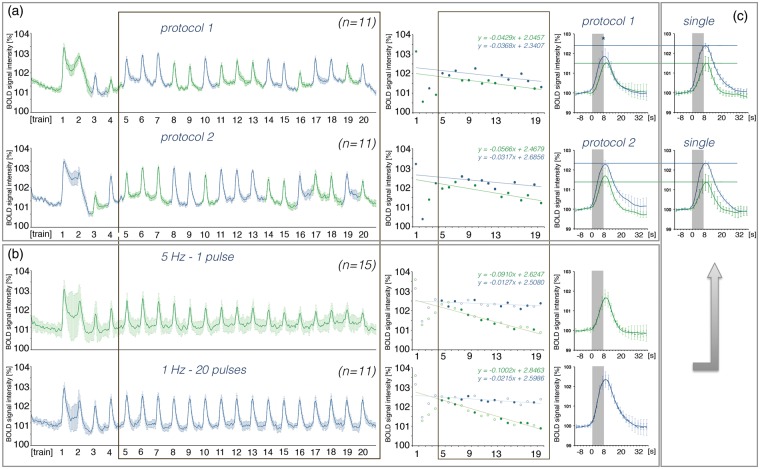
Figure 6.
Application of an alternative stimulation protocol affects the development of BOLD responses to low frequency (5 Hz, green color) but not to high-frequency (1 Hz-20-pulse, blue color) stimulation. (a) Left panel: BOLD time series measured during alternate stimulations starting with a 5 Hz (protocol 1, top) or a 1 Hz-20-pulse (protocol 2, bottom) protocol. Middle panel: Summary of individual BOLD responses during stimulation and their respective decline over time (calculate between trains 5 and 20). Right panel: Averaged BOLD responses to 5 Hz and 1 Hz-20-pulse stimulation (between trains 5 and 20). (b) Left panel: BOLD time series measured during repetitive 5 Hz- and 1 Hz-20-pulse stimulations. Middle panel: Decline of BOLD responses during repetitive stimulations; top graph depicts all measuring points that correspond to protocol 1 and the lower graph depicts all measuring points that correspond to protocol 2. Right panel: average BOLD responses calculated from all responses between trains 5 and 20). (c) Comparison of BOLD responses observed during application of alternating or single stimulation protocols. An asterisk indicates a significant difference.

