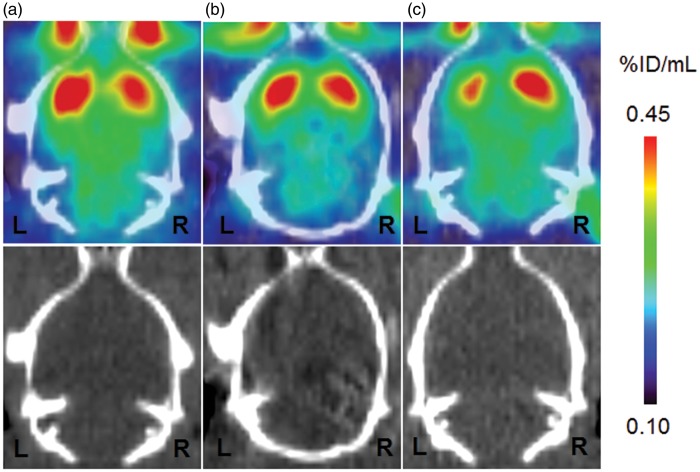
Figure 1.
Typical PET images of [11C]PE2I uptake in ischemia/reperfusion rat brain. The figure shows PET images (0- to 60-min summation images) and the corresponding X-CT images. Scale bar represents % injected dose/mL (% ID/mL). PET and CT images are for 2 days (A), 7 days (B), and 14 days (C) after ischemia/reperfusion. The left side on the images is the ipsilateral side of the striatum.
PET: positron emission tomography; CT: computed tomography.

