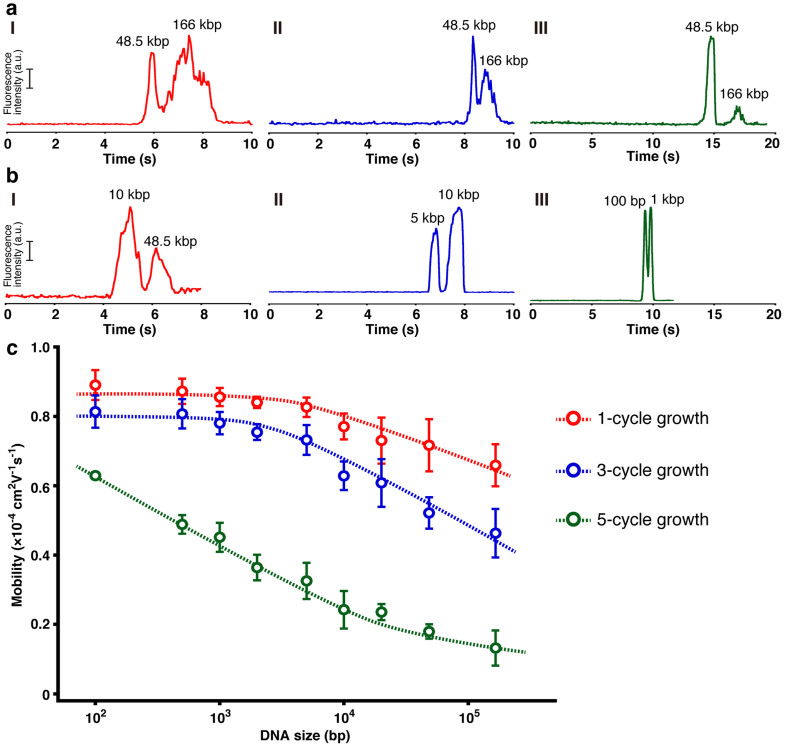
Figure 2. Separation and mobility data in the network structure.
(a) Separation of 166 kbp DNA (20 ng/μL) and 48.5 kbp DNA (50 ng/μL) in the nanowire network structure with the (I) 1-cycle growth nanowires, (II) 3-cycle growth nanowires, and (III) 5-cycle growth nanowires. The electropherogram was obtained at 3 mm from the entrance of the microchannel with the nanowire network structure. The applied DC electric field in the separation channel was 500 V/cm. (b) Separation of (I) 48.5 kbp DNA (20 ng/μL) and 10 kbp DNA (40 ng/μL) in the nanowire network structure with the 1-cycle growth nanowires at the applied DC electric field of 500 V/cm, (II) 10 kbp DNA (30 ng/μL) and 5 kbp DNA (30 ng/μL) in the nanowire network structure with the 3-cycle growth nanowires at the applied DC electric field of 500 V/cm, and (III) 1 kbp DNA (30 ng/μL) and 100 bp DNA (30 ng/μL) in the nanowire network structure with the 5-cycle growth nanowires at the applied DC electric field of 500 V/cm. The electropherogram was obtained at 3 mm from the entrance of the microchannel with the nanowire network structure. (c) Dependence of electrophoretic mobility on DNA size in the nanowire network structure with 1-cycle growth nanowires (red circles), 3-cycle growth nanowires (blue circles), and 5-cycle growth nanowires (green circles). Error bars show the standard deviation for a series of measurements (N = 3).

