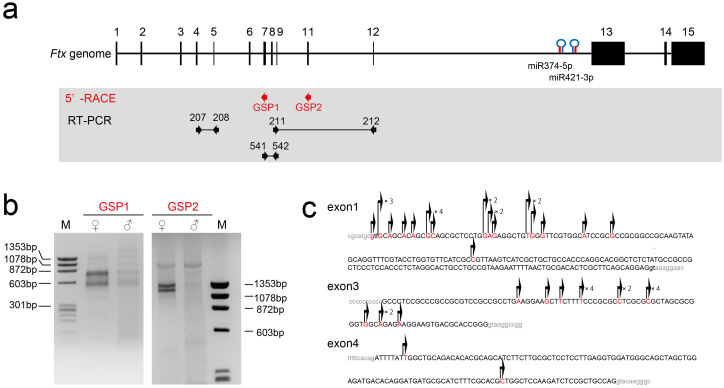
Figure 1. Identification of the 5′ ends of Ftx by 5′-RACE.
(a) Ftx genomic structure in the mouse genome is shown. Exons are indicated by rectangles (black). The two miRNAs, miR-374-5p and miR-421-3p, are clustered in the intron of Ftx. The locations of the gene-specific primers (GSP1 and GSP2) used for 5′-RACE analysis are shown as red arrows. The RT–PCR primer positions used to assess the Ftx expression levels are shown as black arrows. (b) Ethidium bromide-stained gel of 5′-RACE products: ♀, female blastocysts; ♂, male blastocysts; M, molecular-weight markers (PhaiX174 HaeIII digest). (c) Summary of 5′-RACE sequences. Transcriptonal start sites of each clone are indicated in red and with arrows. The numbers of clones of the same squence are shown to the right of the arrows. The starts sites tended to distribute within each exon. Reported exon sequences are indicated by capital letters.

