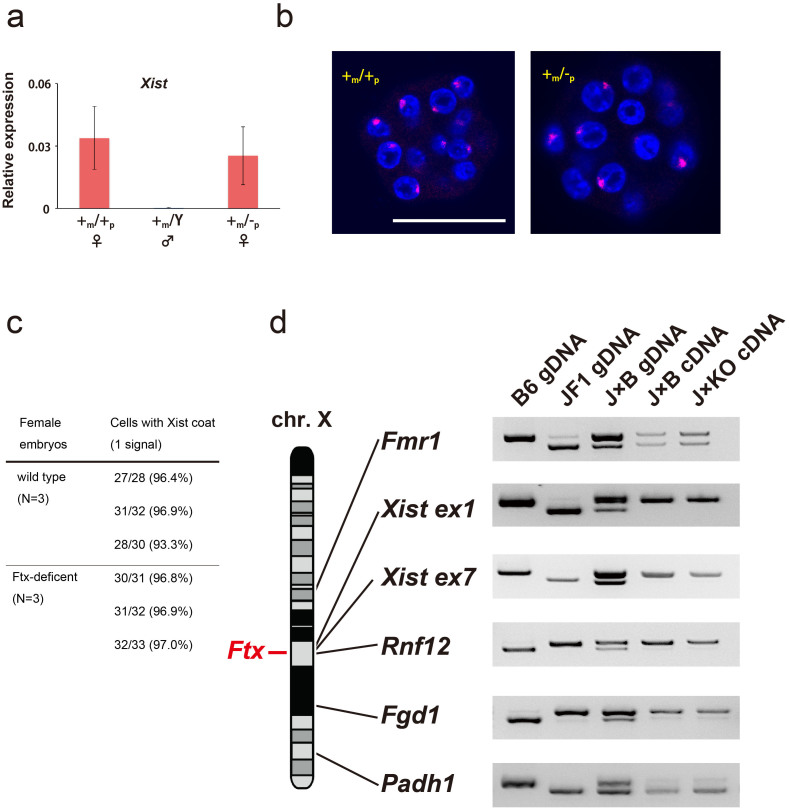
Figure 3. Expression of Xist in Ftx-deficient blastocysts.
(a) q-PCR analysis of Xist RNA in Ftx-deficient blastocysts. The ratios of the number of cDNA copies for Xist to that of cDNA copies for a housekeeping gene, β-actin, are indicated as expression levels. The bar graphs and lines show the mean ± standard deviation (SD) (n = 3). (b) RNA FISH analysis for Xist (red) expression in Ftx-deficient blastocysts. The nuclei of blastocysts were stained with DAPI (blue). Scale bar, 50 μm. (c) Summary of Xist RNA FISH analysis. Three wild-type (+m/+p) and Three Ftx-deficient (+m/−p) blastocysts were examined. Cells with 2 Xist signals were not observed. (d) Analysis of X-linked gene expression levels in Ftx-deficient blastocysts. No differences in the allelic expression patterns of X-linked genes between JF1 and C57BL/6N embryos were detected using RFLP. Uncropped images of the full-length gels are presented in Supplementary Figure S1.

