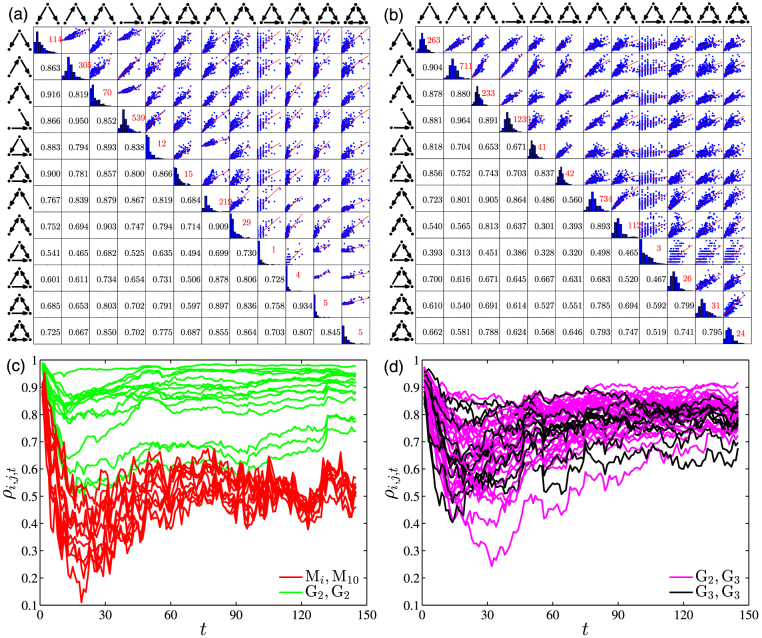
Figure 3. Correlation of motif counts in 248 dependence networks.
(a) The panels in the upper triangle are scatter plots of motif counts between 13 motif counts on day 7. There are no M9 motifs detected in the dependence networks. The correlation coefficients of motifs counts are presented in the lower triangular panels. Each diagonal panel shows the count distribution of these motifs and also the average motif count. (b) Same as (a) for day 30. (c) Evolution of motif count correlation coefficient ρi,j,t between M10 and other motifs (red curves) and between open motifs in the second group (green curves). (d) Evolution of motif count correlation coefficient ρi,j,t between close motifs in the third group (black curves) and between open motifs in the second group and close motifs in the third group (magenta curves).

