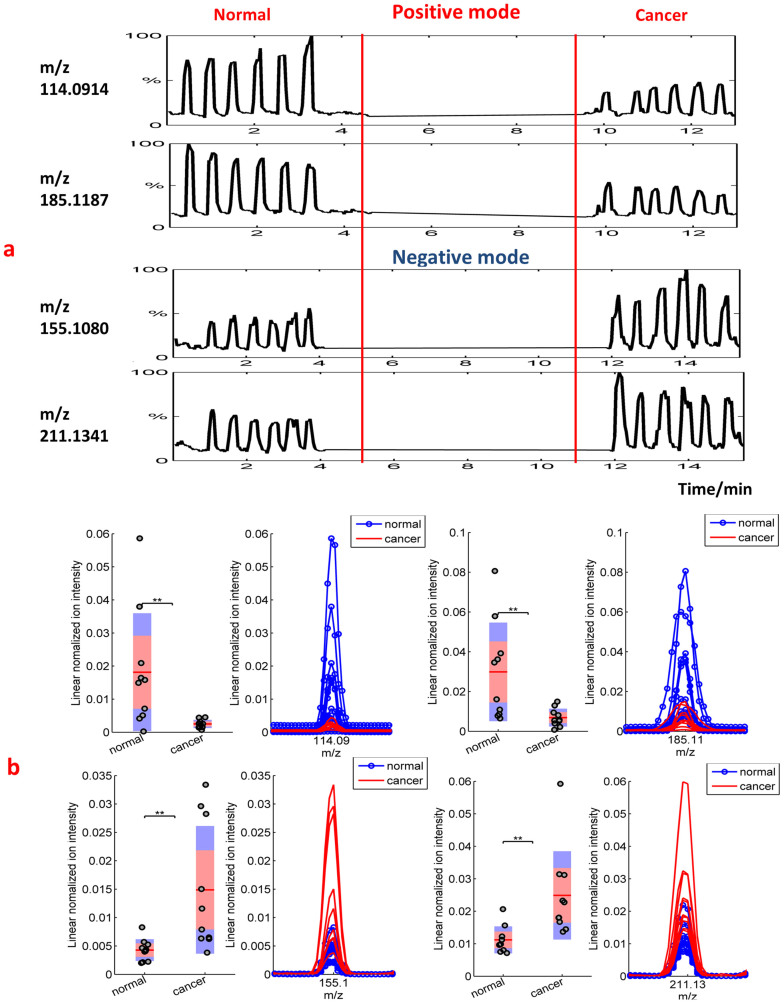
Figure 1.
(a) Typical series of real-time headspace analyses recorded from culture medium of normal and cancerous cells. The relative intensity vs. scan numbers of four compounds is shown (m/z 114.0914, m/z 185.1187 in positive mode and m/z 155.108, m/z 211.1341 in negative mode, respectively). From each culture, six consecutive headspace samples were analyzed, and they had a comparable height within each sample, but the intensities were different between various samples. (b) Box plots of two exemplarily features (in both negative mode and positive mode) that show significantly different molecular profiles. The asterisks on the top of the figures represent p-values (one asterisk: P < 0.05, two asterisks: P < 0.01, three asterisks: P < 0.005), which were computed using a Mann–Whitney U test. The peaks on the right show zoomed views of the corresponding mass spectra.

