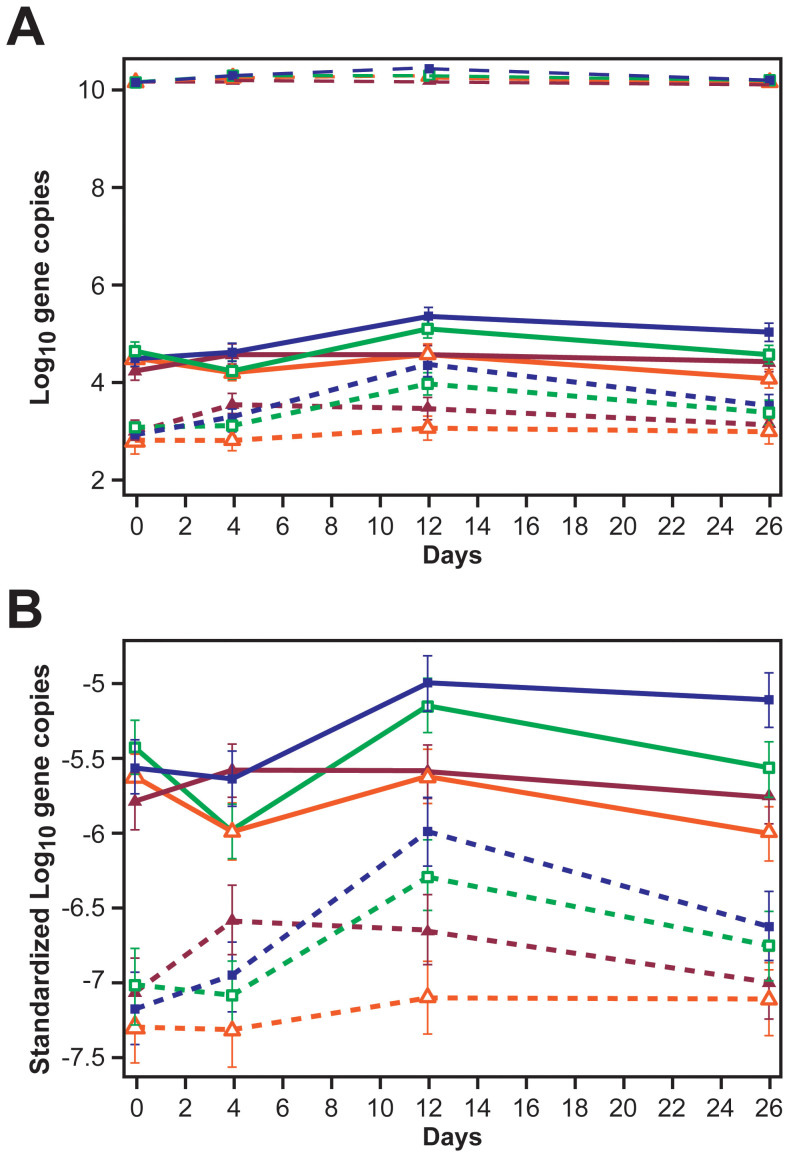
Figure 4. Line graphs illustrating (A) non-standardized log10 blaCTX-M (short dashed lines), non-standardized log10 blaCMY-2 (solid lines), and log10 16S rRNA (long dashed lines) gene copies per gram wet feces (B) standardized (as ratio to log10 16S rRNA) log10 blaCTX-M (short dashed lines) and log10 blaCMY-2 (solid lines) gene copies per gram wet feces, by treatment groups and over days. See Figure 3 for treatment groups key.
(Data are marginal means and error bars represent 95% confidence intervals).

