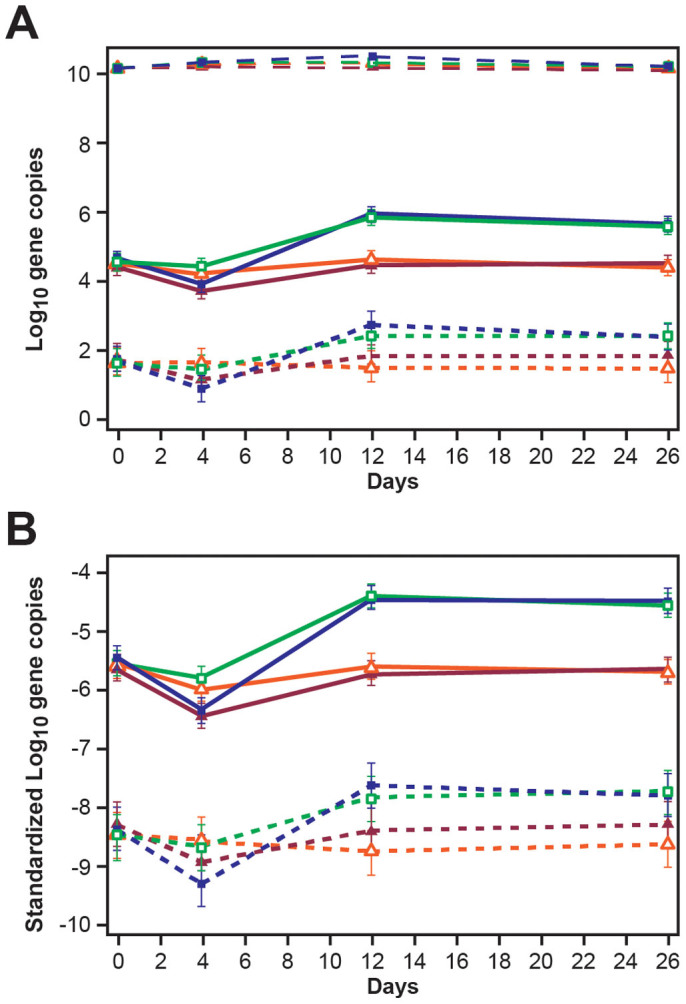
Figure 5. Line graphs illustrating (A) non-standardized log10 tet(B) (short dashed lines), non-standardized log10 tet(A) (solid lines), and log10 16S rRNA (long dashed lines) gene copies per gram wet feces (B) standardized (as ratio to log10 16S rRNA) log10 tet(B) (short dashed lines) and log10 tet(A) (solid lines) gene copies per gram wet feces, by treatment groups and over days. See Figure 3 for treatment groups key.

(Data are marginal means and error bars represent 95% confidence intervals).
