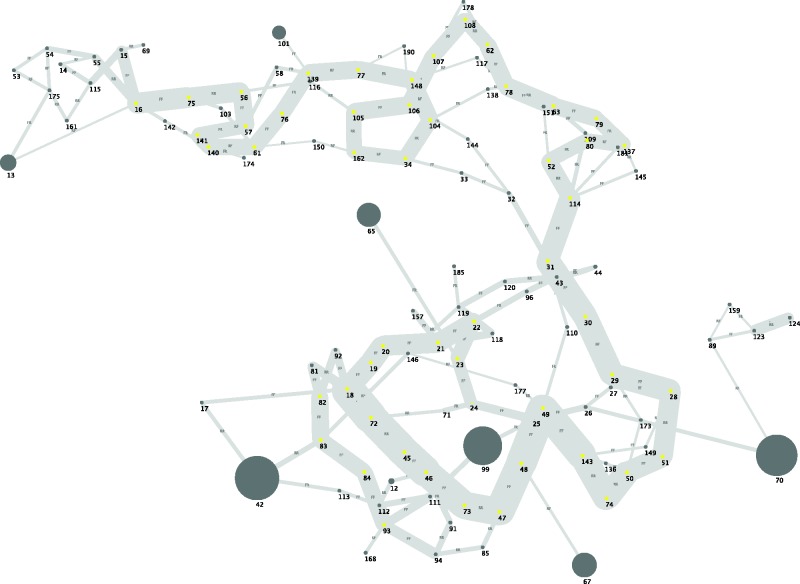
Fig. 3.—
Simplified De Bruijn graph showing the connexions among viral contigs after assembly of Illumina reads. Each circle, so called node in the Velvet terminology, represents a contig. Its diameter is proportional to its length. Each edge connection between two contigs indicates contiguity among contigs. Edge width is proportional to the number of connexions found among nodes. The dark grey circles represent the eight large contigs identified by Velvet assembler (13, 101, 65, 42, 99, 70, 67, 12).

