
FIGURE 3.
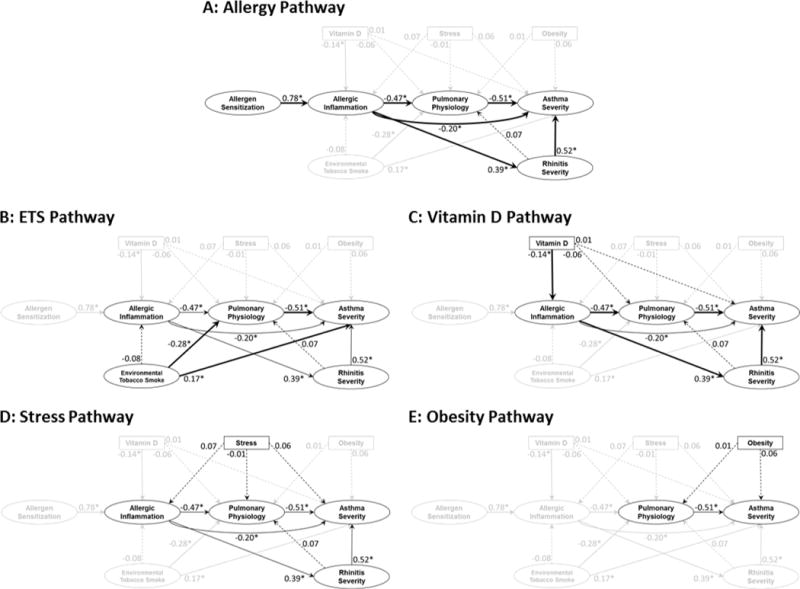
Pathways to Asthma Severity. Estimates are standardized direct effects that are interpreted as the standard deviation increase in the dependent domain for every one standard deviation increase in the independent domain. Estimates with associated p-values that are less than 0.05 are denoted by * and solid lines. Thick lines further denote statistically significant pathways by tests of indirect effects and mediation. Statistically insignificant estimates are denoted by dashed lines. All estimates are adjusted for age, sex and race.