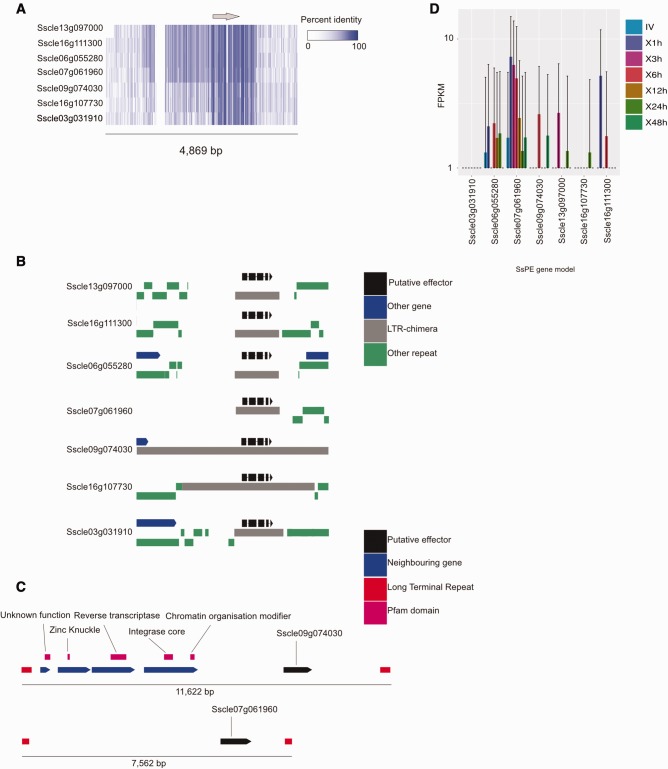
Fig. 5.—
A seven member SsPE family associated with transposition of a retro element. (a) Alignment of the seven paralogous SsPEs (six of which were identified by Guyon et al.), including flanking genomic regions. Coloring from white (0%) to blue (100%) represents identity across the multiple alignment. The gray arrow above represents the position of the SsPE loci in relation to the alignment of the flanking regions. (b) The genomic context of each of the seven SsPEs. Black gene diagrams represent SsPEs, gray bars represent fragments or the complete Gypsy retro element associated with this family, green bars represent other adjacent repeats, and blue gene diagrams represent other gene models. (c) Genomic context of two SsPEs flanked by corresponding LTR sequences and target site duplications. Red bars represent LTRs, black gene diagrams represent positions of SsPEs, magenta bars represent Pfam domains of genes in this region, blue gene diagrams represent other genes. (d) Expression of the seven member SsPE family in vitro and across the B. napus time points tested. Expression (FPKM + 1) is plotted on the y axis. Bars represent standard deviation. Different colored bars represent different sample conditions for each SsPE.

