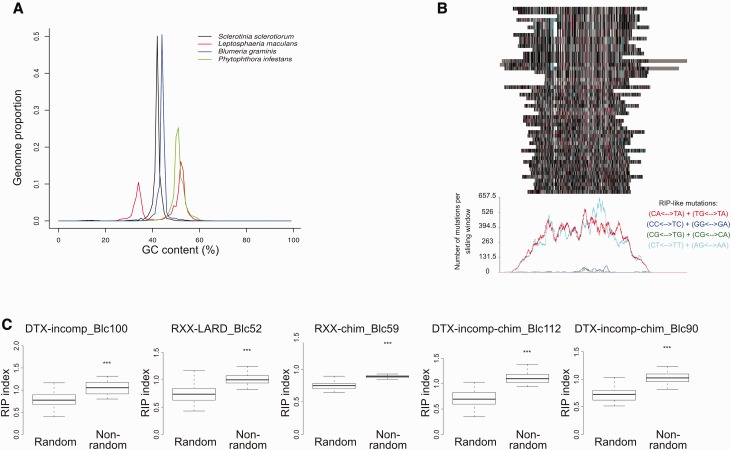
Fig. 6.—
Analysis of RIP in the version two S. sclerotiorum genome. (a) Plot from OcculterCut analysis showing GC content for S. sclerotiorum, P. infestans, L. maculans, and B. graminis f. sp. Hordei. The x axis scale is GC content (%) and the y axis scale is proportion of the genome that shows a GC content of x percentage. (b) RipCal alignment based analysis of the most abundant repeat in the S. sclerotiorum genome “RXX-chim_Blc59_repet-L-B64-Map1_reversed.” The colored bars at the top of the figure represent an alignment of the 50 longest copies of this repeat. Red bars represent likely CpA = > TpA mutation, blue bars represent likely CpC = > TpC mutation, green bars represent likely CpG = > TpG mutation, and turquoise bars represent CpT = > TpT mutation; gray bars, black bars and white bars represent mismatches, matches, and gaps relative to the consensus sequence, respectively. Graph below shows total number of mutations for each potential type of RIP (i.e., CpA = > TpA, CpC = > TpC, CpG = > TpG, CpT = > TpT) at each site in the alignment. (c) Comparison of the TpA/ApT index for the five most numerous repeats in the version two S. sclerotiorum genome against a random set of equivalent sequences from the same genome (same number and sizes). Only the 50 longest sequences were considered for each repeat family. The y axis scale represents the TpA/ApT index for each set of sequences. Black bars represent median values and boxes and whiskers represent second and third quartiles, and interquartile range, respectively. Asterisks represent statistical significance (***P < 0.001; Student’s t-test).

