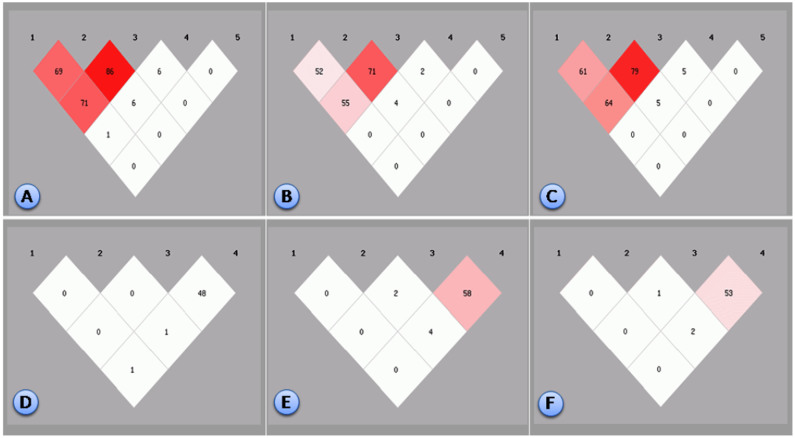
Figure 3. Linkage disequilibrium statuses of the MLXIPL, BUD13 and ZNF259 SNPs.
Linkage disequilibrium among the (1) ZNF259 rs2075290, (2) ZNF259 rs964184 and (3) BUD13 rs10790162, (4) BUD13 rs17119975 and (5) BUD13 rs11556024 SNPs in the Mulao (A), Han (B) and combined Mulao and Han populations (C). Linkage disequilibrium among the (1) MLXIPL rs799161, (2) MLXIPL rs35332062, (3) MLXIPL rs3812316 and (4) MLXIPL rs13235543 SNPs in the Mulao (D), Han (E) and combined Mulao and Han populations (F). The linkage disequilibrium status is illustrated by the magnitude of the r2 value.

