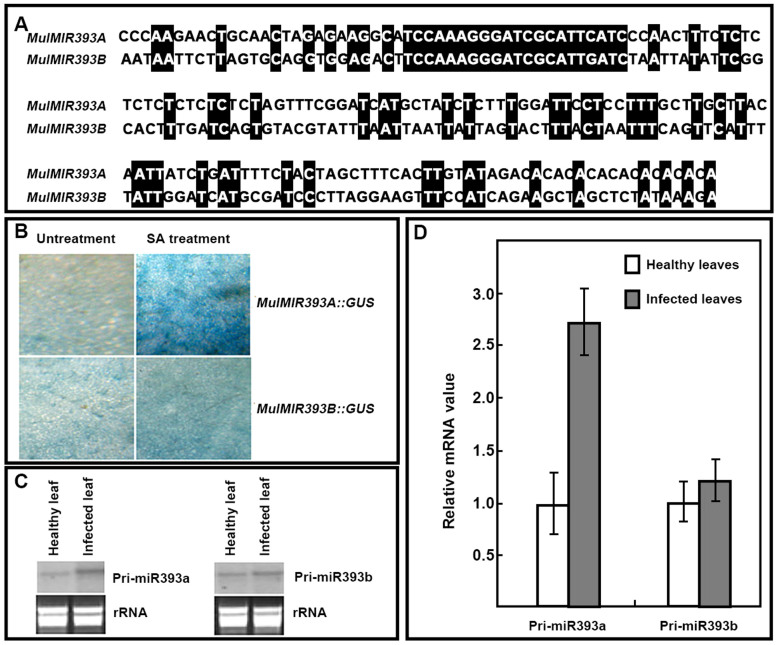
Figure 7. Comparison of nucleotide sequences of MulMIR393A and MulMIR393B, MulMIR393A::GUS and MulMIR393B::GUS activity, and pri-miR393a pri-miR393b abundance analysis.
(A) Comparison of nucleotide sequences of MulMIR393A and MulMIR393B. Identical nucleotides were black shaded. (B) MulMIR393A::GUS and MulMIR393B::GUS activity analysis by histochemical staining. Histochemical staining for GUS activity was performed 24 h later after application of SA with X-gluc as a substrate. (C) Pri-miR393a and pri-miR393b abundance analysis by northern blot. (D) Pri-miR393a and pri-miR393b abundance analysis by real-time PCR. The relative gene expression was evaluated using comparative Ct method taking actin (Accession No. DQ785808) as the reference gene. Values are given as mean ± SD of three experiments in each group.

