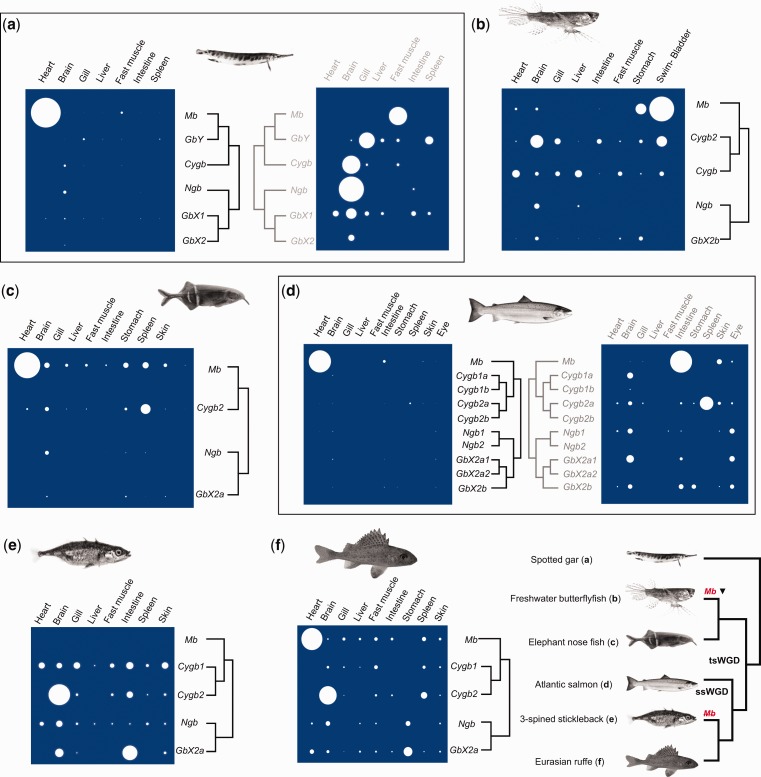
Fig. 6.—
Summary of mRNA level globin family member gene expression analysis spanning ray-finned fish evolution. For each included species, across-tissue expressions of all globin genes identified in our study are shown, along with a tree to depict globin family phylogenetic relationships. The area of each circle represents the mean expression level from different biological replicates (n = 4 or 5 per species). Each study species is shown, along with a phylogenetic tree of all included species, in a panel at the figures bottom right. The tree also shows two independent events in evolution where the ancestral condition of high Mb expression in heart muscle was lost via either downregulation of mRNA-level gene expression (‘Mb ▾’) or by pseudogenization (Mb) (after Macqueen et al. 2014). For spotted gar and Atlantic salmon, data is shown with and without inclusion of Mb expression data in heart, due to the obscuring effect of high expression on other visualized data. Individual data for all species and genes, including means +SD is provided in supplementary figs. S2–S7, Supplementary Material online.

