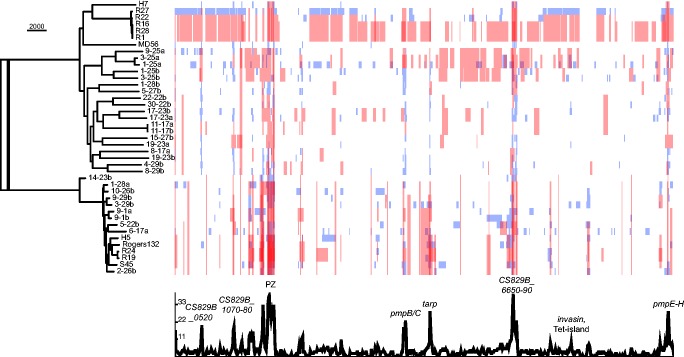
Fig. 3.—
Recombinations detected within C. suis. The recombination-adjusted phylogeny is shown on the left, with genome tracks to the right showing blocks of recombination that have been identified in a single strain in blue, and in a clade ancestor in red. The plot below shows recombination density along the genome. This figure is based on alignment data from all assemblies, covering 89% of the genome. A further analysis of all but two strains is shown in supplementary fig. S3, Supplementary Material online, and highlights a further region of high recombination around ompA (CS829B_7350), which did not align in this dataset. Bootstraps are not provided post-removal of recombinations. Scale bar indicates the number of nucleotide substitutions.

