Fig. 2.—
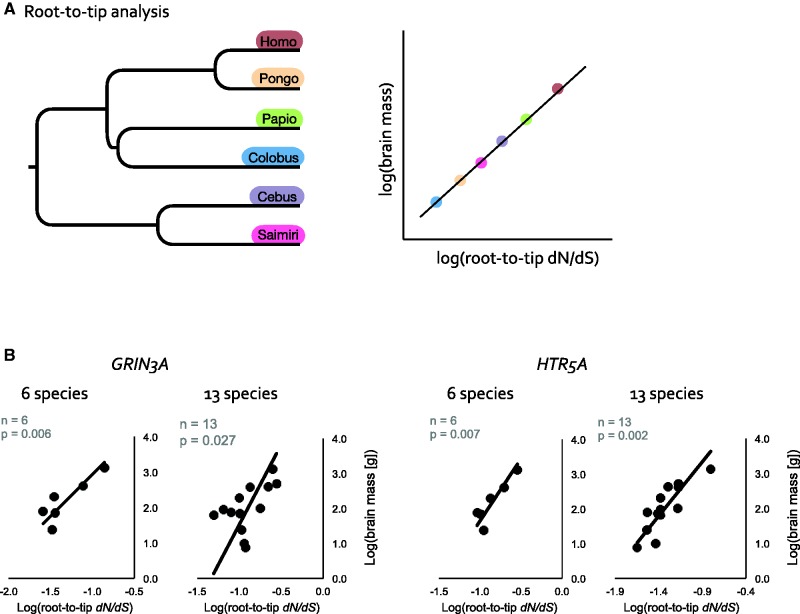
Tests for coevolution of dN/dS and brain size across primates. (A) An illustrated example of our test for coevolution of gene–phenotype. We calculated root-to-tip dN/dS ratios for each species, for each gene (indicated by the individual colors on the tip of the tree). Using a phylogenetically controlled method, we tested for a relationship between the gene (i.e., root-to-tip dN/dS) and the phenotype (e.g., brain mass or EQ). A linear relationship between gene and phenotype provides support for coevolution, as hypothetically illustrated in (A). This test for gene–phenotype coevolution would show small patterns of change across genes. (B) A linear relationship was found between GRIN3A and brain mass using the original six-species data set and the expanded 13-species data set (left), and between HTR5A and brain mass using the original six-species data set and the expanded 13-species data set (right). The raw data is displayed with the phylogenetically controlled regression overlaid.

