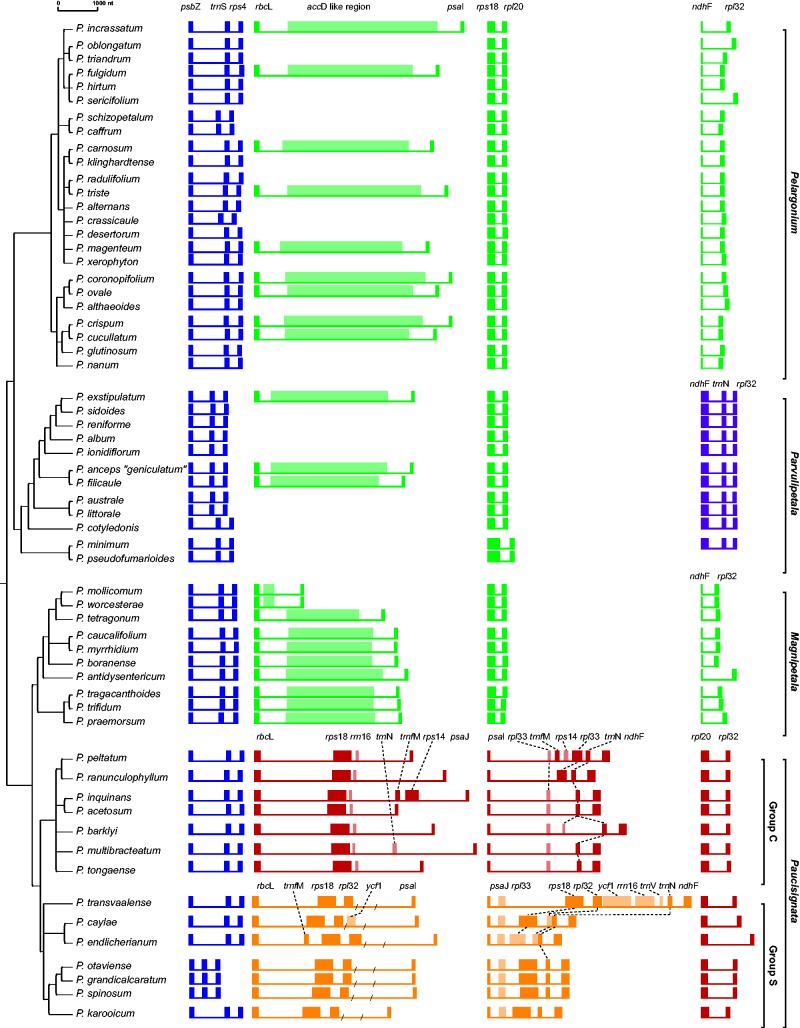
Fig. 1.—
Plastome rearrangements in Pelargonium. Differences in gene order between clades are color-coded and the gene content per region is given on top. Lighter colors demarcate pseudogenes. Lengths of inversion breakpoints and of coding and noncoding regions are to scale. The tree topology was inferred with a maximum likelihood analysis of the psbZ–trnSGAA–rps4 region. Names of subgenera and subgroups are shown to the right.

