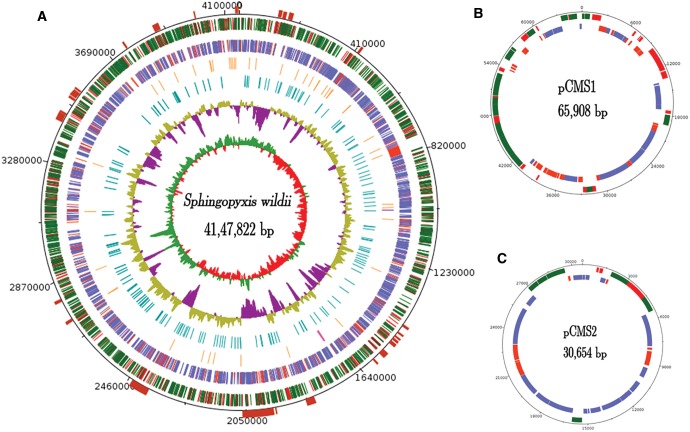
Fig. 1.—
The circular maps of the S. wildii genome and plasmids: (A) Circles 1 and 2 (from exterior to interior) represent CDS on forward (green-annotated, red-hypothetical) and reverse strands (blue annotated, red hypothetical); circles 3 and 4 show RNA genes (orange for tRNA, pink for rRNA, and purple for tmRNA); and VNTRS (turquoise). The GC content (olive for positive and purple for negative) and GC skew (green for positive and red for negative) are shown in 5 and 6. The maroon blocks shown above circle 1 represent genomic islands. CDS on the forward (green for annotated, red for hypothetical) and reverse strands (blue for annotated, red for hypothetical) of plasmids pCMS1 and pCMS2 in (B, C).

