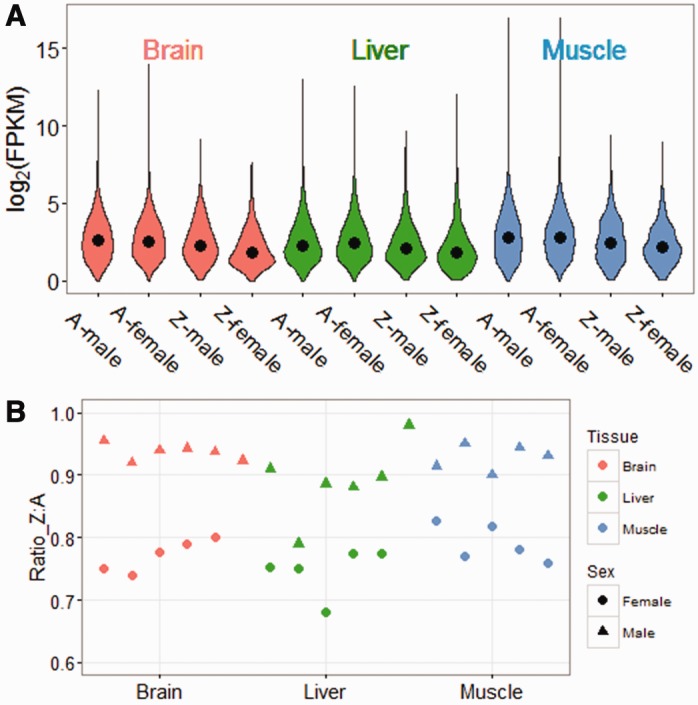
Fig. 1.—

Expression status of Z chromosome and Autosome in three tissues. (A) Violin plots show log2(FPKM) for all the genes with significant expression after filtering. For each tissue, we calculated average FPKM of all females or all males from the two interbreed crosses for each gene. The black points in violins refer to median value of all genes. (B) Z:Autosome expression ratio of three tissues of each crossbred individual. Triangles represent females, circles represent males.
