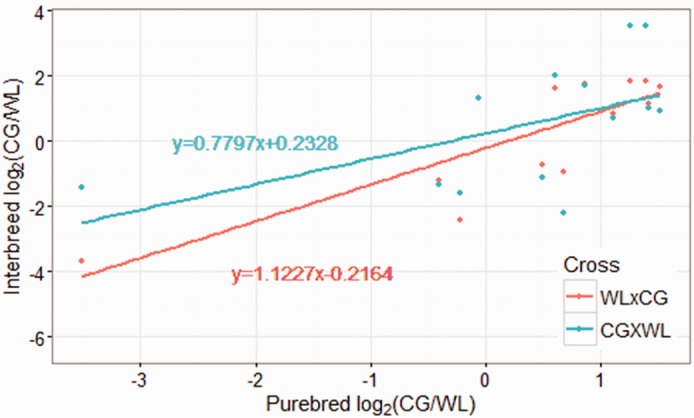
Fig. 4.—

Correlation of ASE genes expression pattern with their parental expression in brain. The X axis shows the expression ratio of purebred CG to purebred WL. The y axis shows the expression ratio of the CG allele to the WL allele in the WL × CG (red) and CG × WL (blue) interbreed crosses.
