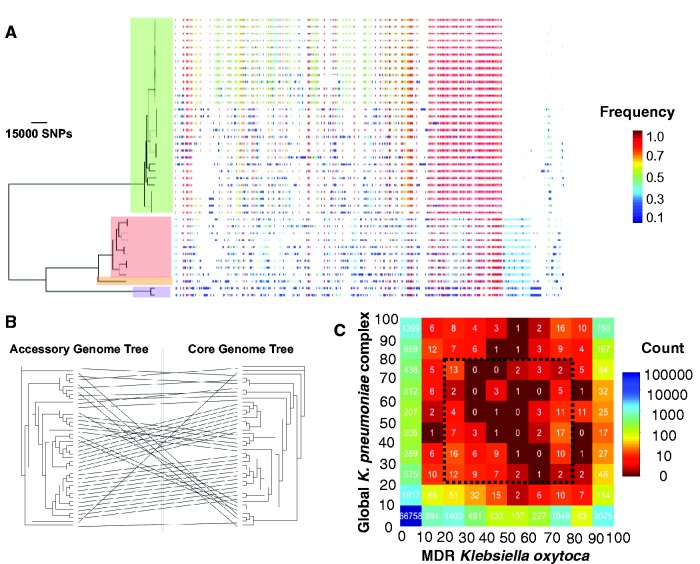
Fig. 3.—
(A) Maximum Likelihood phylogenetic tree drawn for the core genome and the presence and absence of accessory genes in the accessory genome. The colours correspond to the frequency of accessory genes across the whole population. The clade colours are the same as in figure 1A and show Klebsiella oxytoca phylogroups. (B) Comparison between the core genome tree and the tree based on the presence-absence patterns of elements in the accessory genome. (C) The table of genes in the pan-genomes of K. oxytoca and Klebsiella pneumoniae complex. The colours signify the absolute frequency. The number on the axes denotes the relative frequency of the genes in either population (expressed in %). Note the first column and row of the table also shows genes that are completely absent in the other species. The dotted box shows acquired accessory genes in >20% and <80% of isolates within either species.

