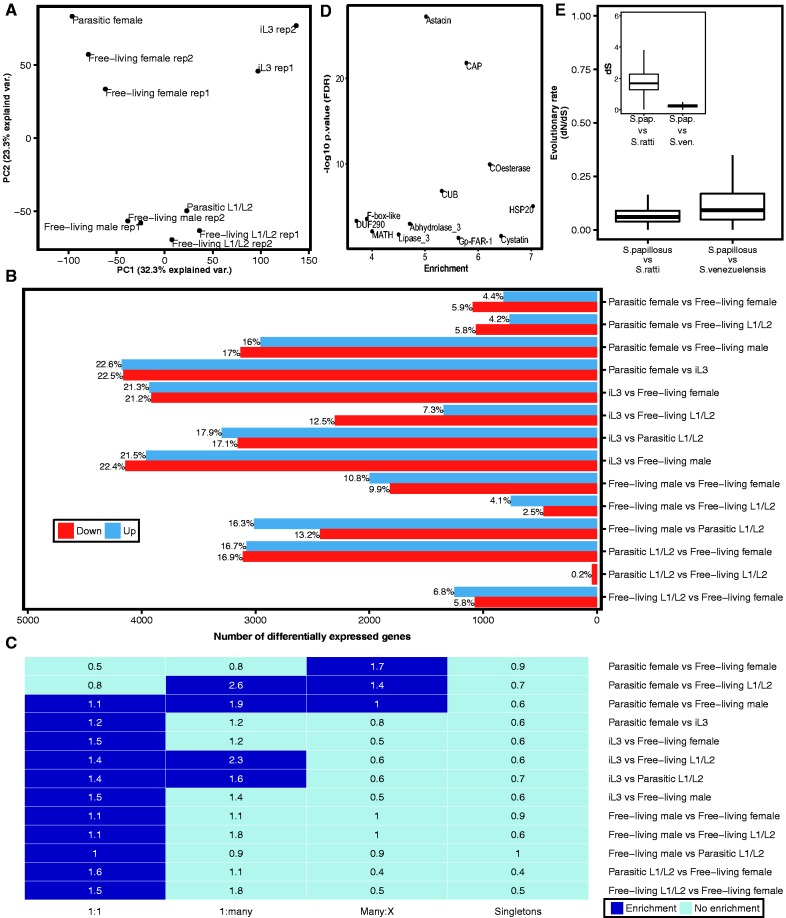
Fig. 2.—
Comparison of S. papillosus developmental transcriptomes. (A) Principal component analysis of expression values shows a subdivision of transcriptomes into distinct clusters that are defined by developmental stage and sex. (B) Numbers of significantly differentially expressed genes (FDR-corrected P value <0.05) for each comparison. (C) Overrepresentation analysis of distinct orthology classes reveals that most comparisons are enriched in one-to-one orthologs. Dark blue color indicates significant enrichment (FDR-corrected P value <0.05 and enrichment value >1). The number inside each cell represents the enrichment value. (D) Enrichment of protein domains (PFAM) among genes up-regulated in parasitic females in comparison with free-living females (FDR-corrected P value <0.05 and enrichment value >1). (E) Box plot representation of the evolutionary rates of one-to-one orthologous genes as measured in dN/dS (ω) across two different species comparisons. Both comparisons show that one-to-one orthologous genes are under strong purifying selection. The inlay shows age of one-to-one orthologous genes as measured in dS (synonymous substitutions rate). Median dS of S. papillosus–S. venezuelensis one-to-one orthologs is < 1, indicating that number of synonymous substitutions is not saturated.

