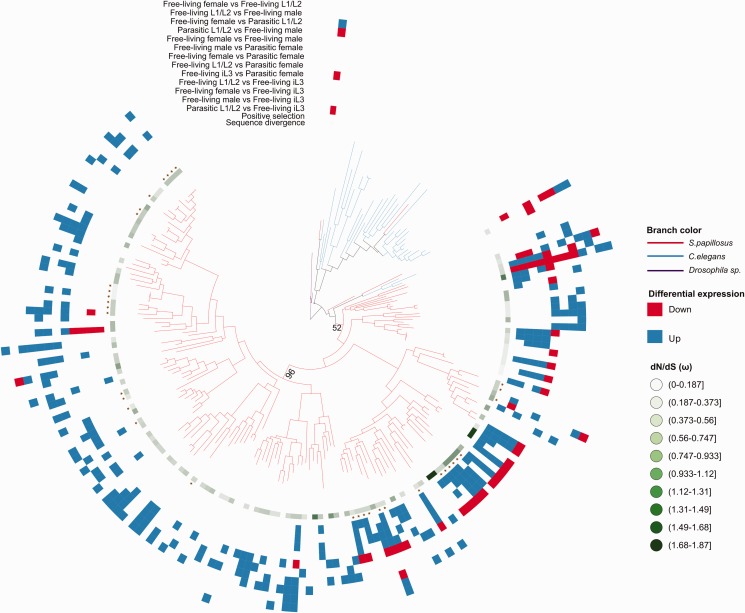
Fig. 4.—
Gene duplication in CAP gene family. Phylogenetic tree reconstructed using CAP genes amino acid sequence from S. papillosus (red branches), C. elegans (blue branches) and Drosophila Sp. (purple branches). The Tree shows lineage-specific expansion of CAP genes in the Strongyloides lineage. Due to poor visibility, only bootstrap values that are relevant for our analysis are shown. Bootstrap support for all branches of the tree is shown in supplementary figure S5, Supplemental Material online. The color patterns and symbols for each S. papillosus gene were generated by testing sequence evolution and differential expression. The green gradient indicates the sequence evolutionary rate as measured in dN/dS (ω). The star symbol indicates the evidence for positive selection in the gene sets. The heatmap of blue, red and white shows the differential expression pattern for each S. papillosus gene based on the pairwise comparison of all sequenced developmental stages. Up-regulation, down-regulation and no change in gene expression are shown in blue, red and white, respectively.

