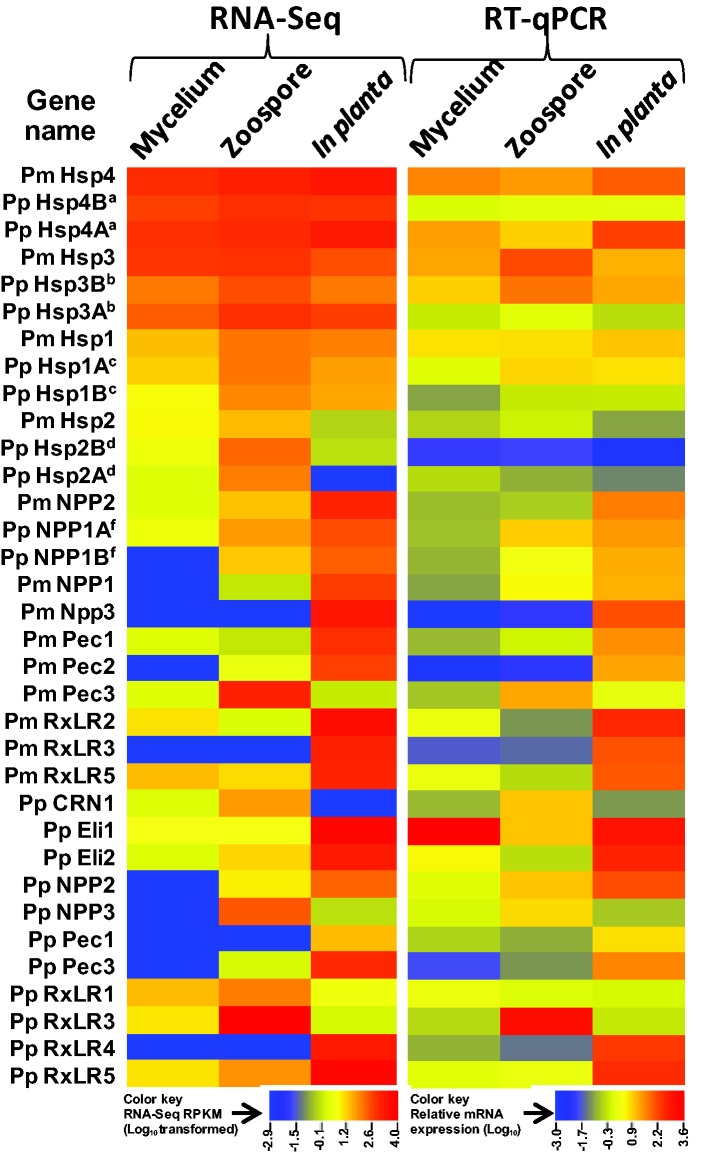
Fig. 3.—
Heatmap comparison of RNA-Seq and RT-qPCR data. Fourteen P. megakarya genes and 20 two P. palmivora genes were identified by RNA-Seq analysis as being differentially expressed in mycelium, zoospores, and in planta. Relative mRNA expression levels were quantified relative to that of the housekeeping PGeneM PmTP/PpTP by the 2−ΔΔCt method (Livark and Schmittgen 2001). Both the global normalized value of RNA-Seq and the relative mRNA expression levels were LOG10-transformed to linearize the data, then the heat map was created using CIMminer (http://discover.nci.nih.gov/cimminer). Gene names with similar superscript letters are homeologs. In planta RNA-Seq and all RT-qPCR results are based on three biological replicates. Underlying data are shown in the supplementary Excel file S1, sheet 1: RNA-Seq-RTqPCR comparison, Supplementary Material online.

