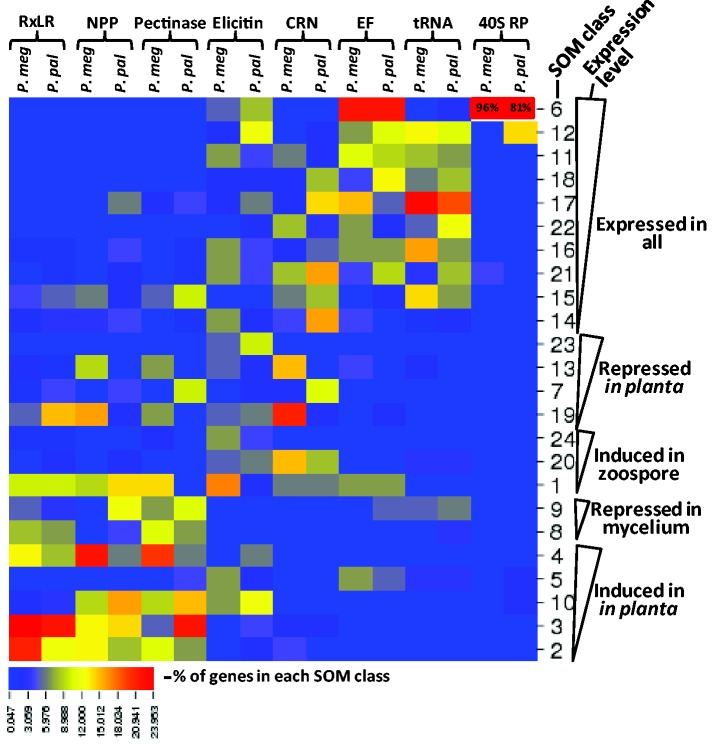
Fig. 5.—
Distributions of gene models from selected gene families among the 24 SOM classes. SOM classes are the same as in figure 4. Expression levels were based on the average read counts of each RNA-Seq library. Gene families included are RxLR, necrosis-inducing proteins (NPP), pectinases, elicitins, crinklers (CRN), elongation factors (EF), amino-acyl tRNA ligases, and 40S ribosomal proteins (40S RP). The percentage of genes from each gene family within a SOM class was used to generate the heat map using CIMminer (http://discover.nci.nih.gov/cimminer).

