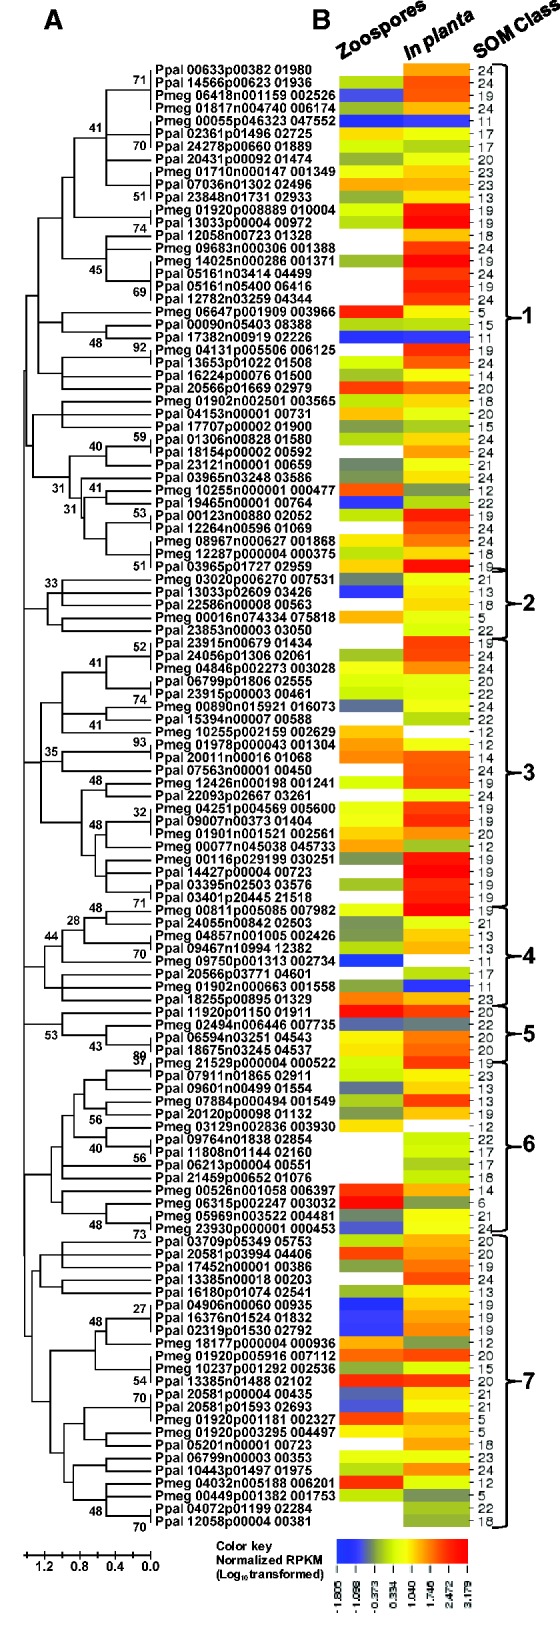
Fig. 6.—

Evolutionary relationships and transcription profiles of 115 transcribed pectinase gene models from P. megakarya and P. palmivora. (A) Amino acid sequences were aligned using MUSCLE (Edgar 2004) and evolutionary relationships were inferred using the Neighbor-Joining method (Saitou and Nei 1987) with bootstrap (100 replicates). Branch lengths represent the number of amino acid differences per sequence. Branches are labeled with bootstrap values. There were a total of 30 informative positions in the final data set. Evolutionary analyses were conducted in MEGA5 (Tamura et al. 2011). (B) For the relative transcription profiles, RNA-Seq read counts for zoospore and in planta libraries were normalized by read counts in the mycelium library and values were LOG10-transformed. The heat map was generated using CIMminer (http://discover.nci.nih.gov/cimminer). Self-organizing classes were as in figure 4. Large bold numbers indicate phyletic groups. White blocks indicate no detectable transcription.
