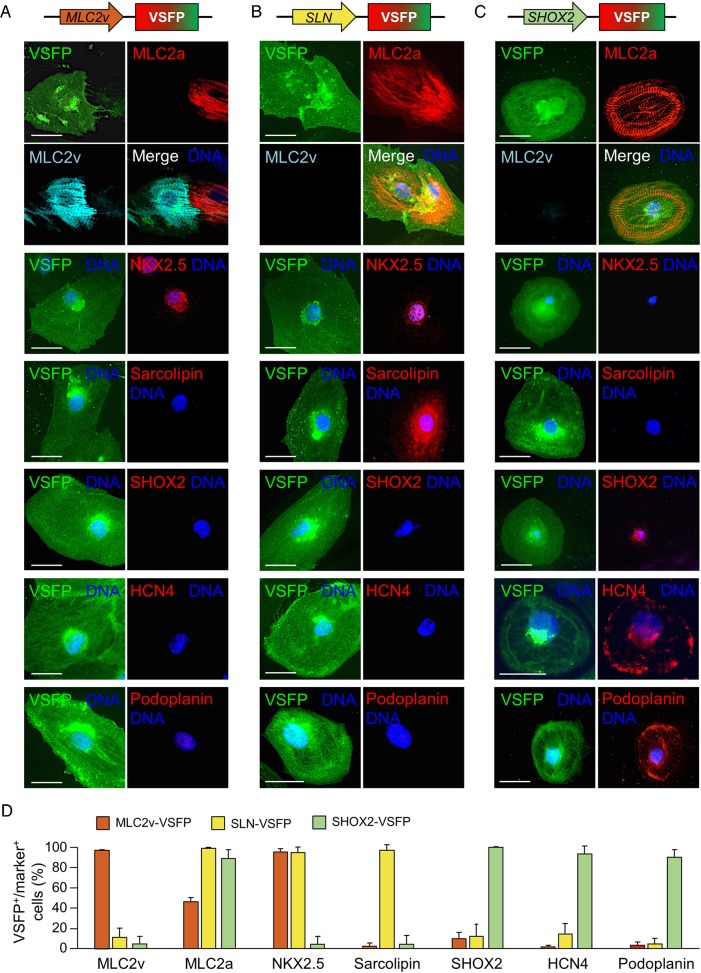
Figure 2.
Molecular characterization of cardiomyocytes marked with subtype-specific membrane potential sensor constructs. Typical pseudocolour images of MLC2v-voltage-sensitive fluorescent protein- (A), SLN-voltage-sensitive fluorescent protein- (B), or SHOX2-voltage-sensitive fluorescent protein-infected (C) cells stained with the indicated antibodies. Scale bars: 20 µm. (D) Percentage of voltage-sensitive fluorescent protein-positive cells expressing the indicated markers. N = 169–975 cells for each marker.

