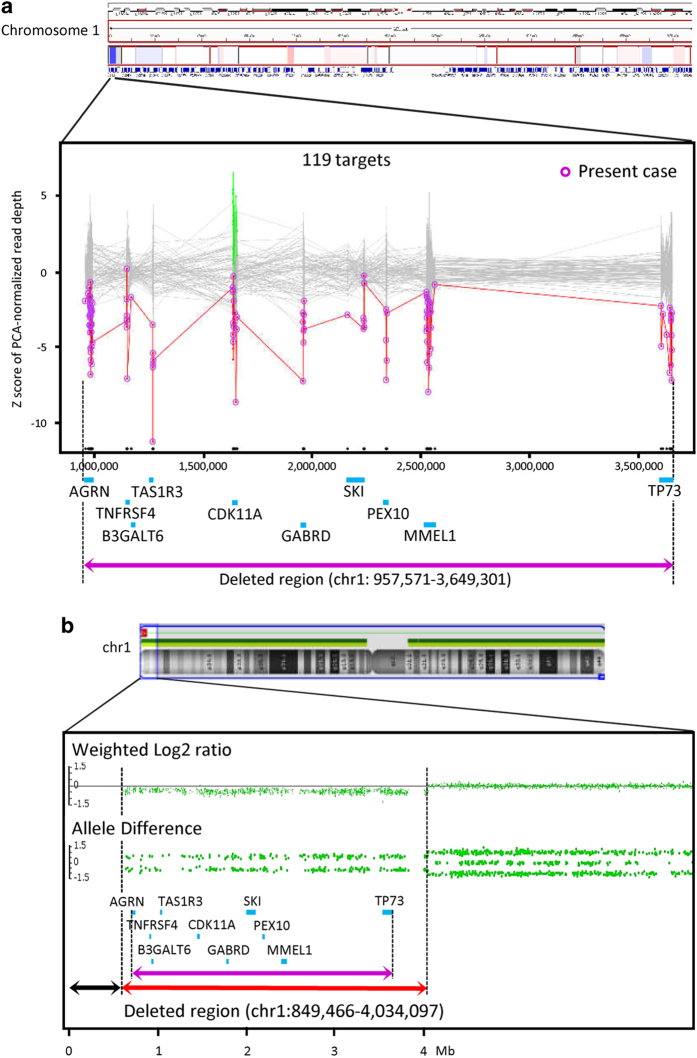
Figure 1.
(a) eXome-Hidden Markov Model (XHMM) analysis using targeted-exome sequencing (TES) data automatically detected the genomic copy number loss of 10 genes (blue bars) located within 1p36.33-p36.32, suggesting a 2.7-Mb deletion (purple closed arrow). The x axis shows the physical position, and the y axis shows the Z score of the principal component analysis (PCA) that was normalized to read depth. Purple circles connected by red lines represent values of the individual subjected to TES. Gray dots with gray connected lines indicate the results of normalized read depth obtained from in-house control data (N=106). Copy number gains (green dots) and losses (red dots) of target sites on the CDK11A gene were detected in three and four control samples, respectively. (b) Chromosomal microarray (CMA) using an Affymetrix Cytoscan HD array demonstrated a 3.2-Mb heterozygous deletion within 1p36.33-p36.32 (red closed arrow). The weighted-copy number log2 ratio, allele peak spots and genes included in Trusight One (blue bars) are shown. Because of the lack of probes in the 850-kb terminal region of 1p36.33 (black closed arrow), additional fluorescence in situ hybridization (FISH) analysis using a subtelomere probe was required to demonstrate the 1p36 terminal deletion. Compared with TES-based copy number variation (CNV) detection, the distal and proximal break points of the deleted region were shifted to the distal and proximal sides, respectively, in CMA (purple closed arrow).

