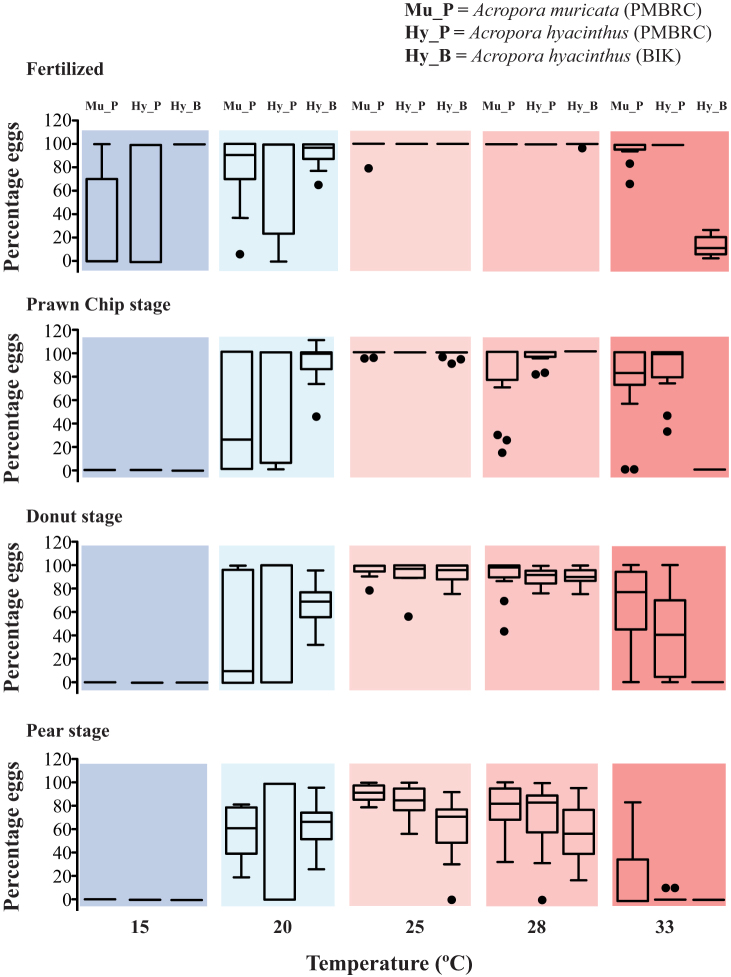
Figure 5. Quantitative data for fertilization; prawn chip, donut, and pear stages at different temperature treatments (15, 20, 25, 28, and 33°C columns are in different colors).
The percentages of individuals reaching each stage that appeared healthy and non-aberrant are plotted. Three bars are depicted for each trial, which correspond to treatments performed with A. muricata in PMBRC (left bar), A. hyacinthus in PMBRC (central bar), and A. hyacinthus in BIK (right bar). Mu_P = A. muricata in PMBRC, Penghu; Hy_P = A. hyacinthus in PMBRC, Penghu, and Hy_B = A. hyacinthus in BIK, Kochi. The box indicates the 25th and 75th percentiles, and the line within the box marks the median. Whiskers below and above the box indicate the 10th and 90th percentiles.

