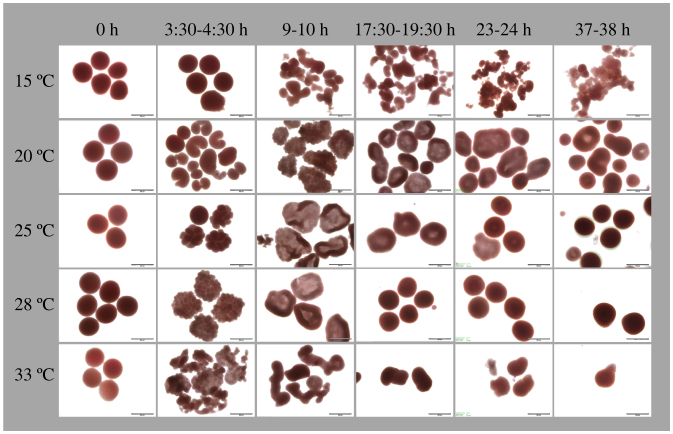
Figure 7. Time series photos showing the effects of temperature on embryonic development in A. hyacinthus at PMBRC, Penghu, Taiwan.
Columns represent the different times elapsing from fertilization (0 h) to motility. Rows represent temperature treatments of 15, 20, 25, 28, and 33°C. Scale bar = 500 μm.

