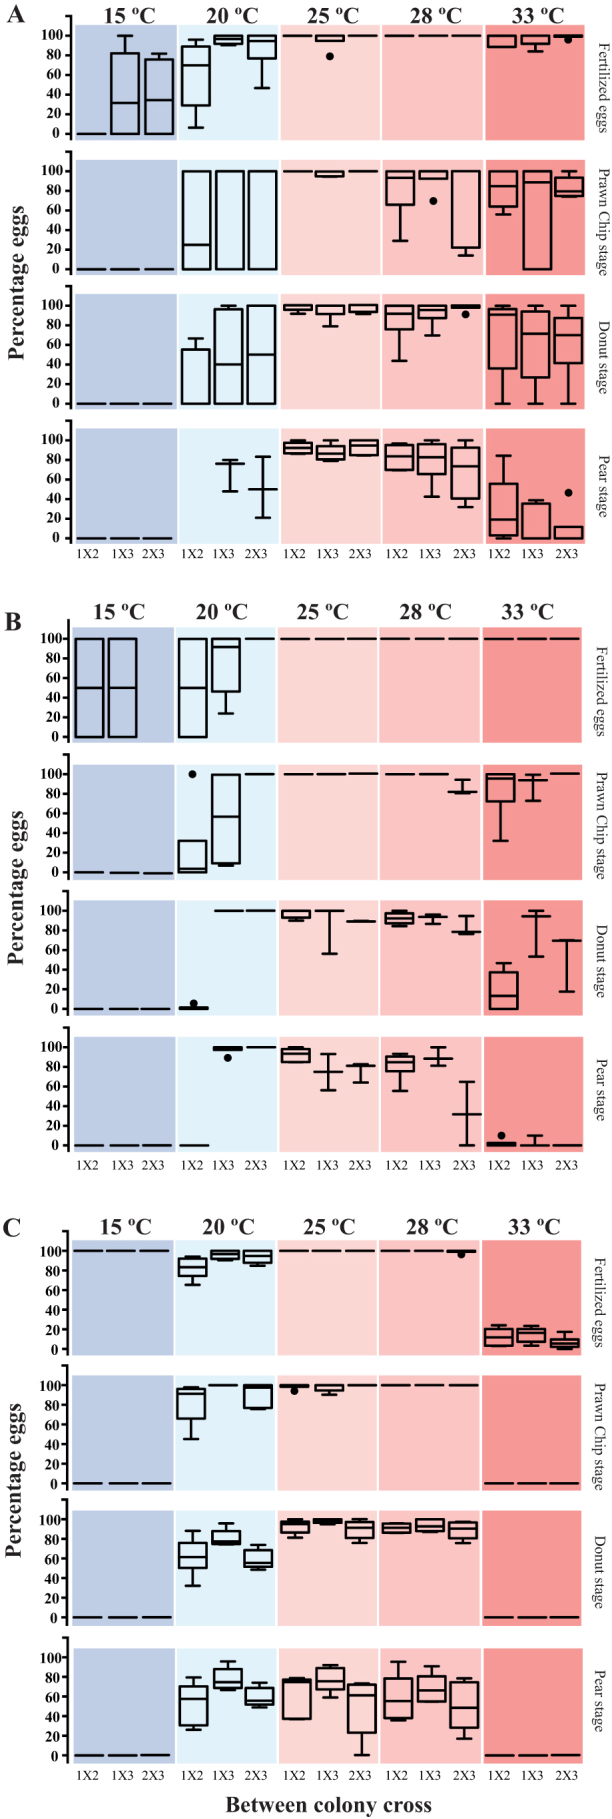
Figure 9. Quantitative data for inter-cross fertilization for the three trials separately: (A) A. muricata in PMBRC, (B) A. hyacinthus in PMBRC, and (C) A. hyacinthus in BIK at different temperature treatments (15, 20, 25, 28, and 33°C columns are depicted in different colors).

The crosses are: 1X2 = cross between colonies 1 and 2, 1X3 = cross between colonies 1 and 3 and 2X3 = cross between colonies 2 and 3. The box indicates the 25th and 75th percentiles, and the line within the box marks the median. Whiskers above and below the box indicate the 10th and 90th percentiles.
