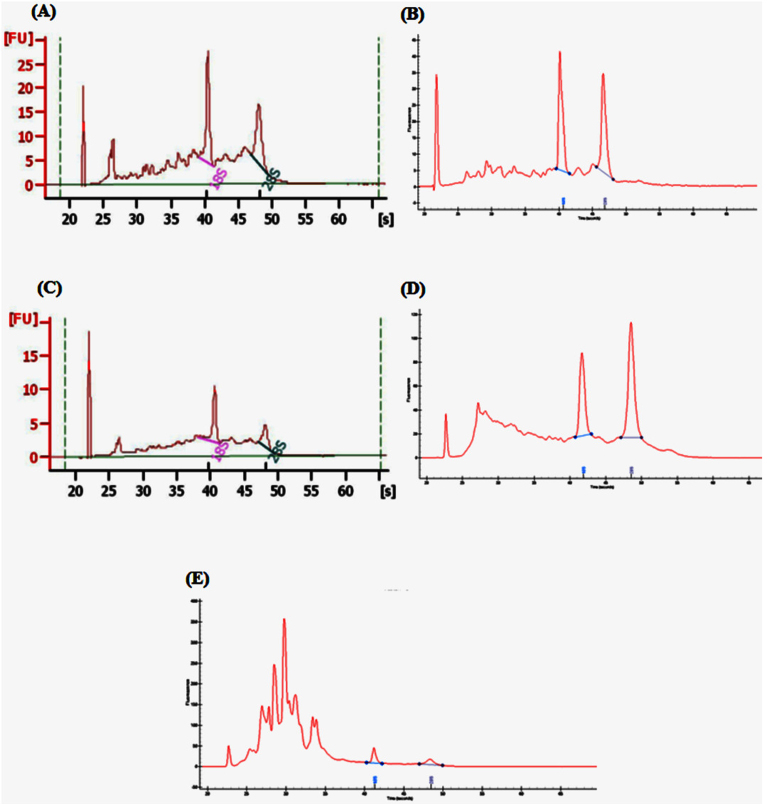
Figure 1. Total RNA capillary electrophoresis chromatograms from mammary and milk fractions.
(A) Mammary tissue (MGT), (B) Somatic cells (SC), (C) Laser capture mammary epithelial cells (LCMEC), (D) Antibody-captured milk mammary epithelial cells (mMEC), (E) Milk fat globule (MFG). Traces (A) and (C) (Agilent Bioanalyzer), traces (B), (D), (E) Experion Analyzer (BioRad). These diagrams show the differences in quality of RNA obtained from the different fractions.

