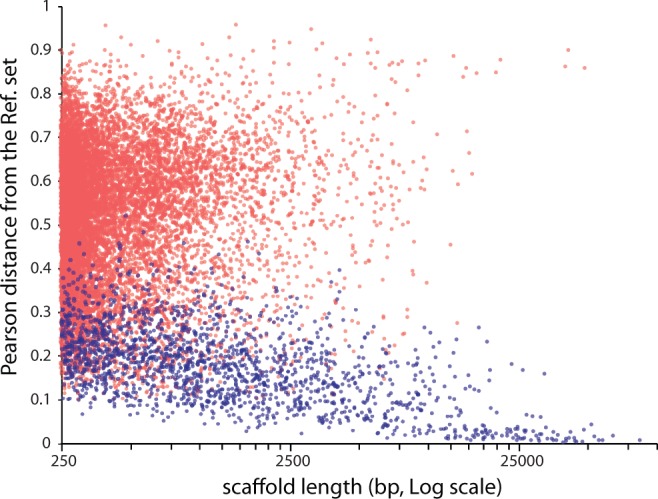
Fig. 2.—

Scatter plot of Pearson distance against sequence length for scaffolds in the 12-Mb assembly. Pearson distance from the reference set of Amphiamblys sp. contigs was calculated using de Bruijn chain genomic signature (Heath and Pati 2007). Blue dots correspond to sequences attributed to the genome of Amphiamblys sp. using genomic signature similarity and repeat finding approaches; red dots represent the rest of sequences in the assembly.
