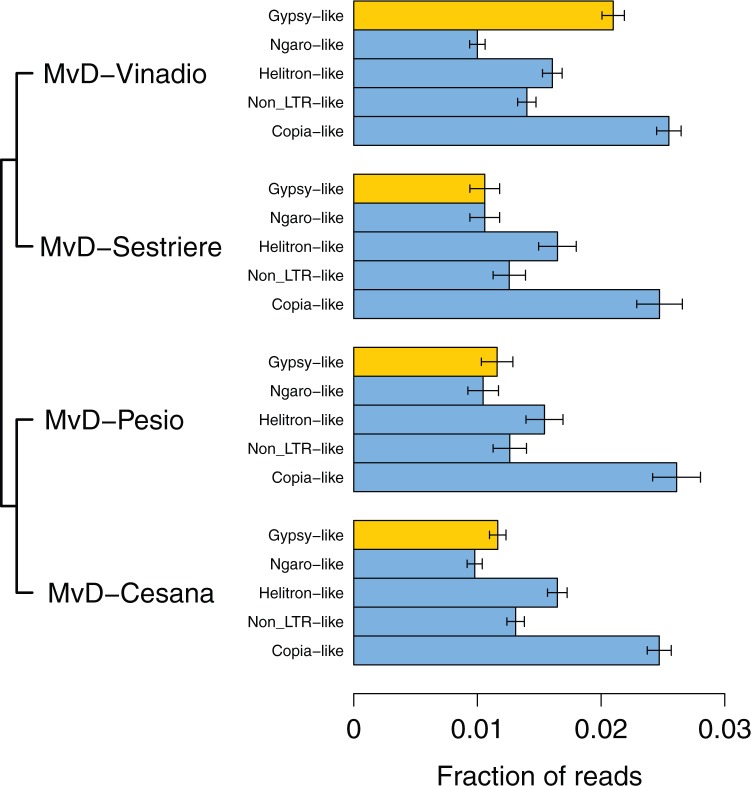
Fig. 1.—
Evolutionary relationships and genomic TE content of Microbotryum strains. Bars display the fraction of whole genome sequencing reads aligning to repetitive element families. Error bars indicate 95% confidence intervals based on binomial sampling. Neighbor-joining phylogeny of Microbotryum strains was constructed based on γ-tubulin DNA sequences.

