F1000Research logoLink to F1000Research
. 2017 Nov 15;6:33. Originally published 2017 Jan 11. [Version 3] doi: 10.12688/f1000research.10541.3

A voltage-dependent fluorescent indicator for optogenetic applications, archaerhodopsin-3: Structure and optical properties from in silico modeling

Dmitrii M Nikolaev 1, Anton Emelyanov 1, Vitaly M Boitsov 1, Maxim S Panov 2, Mikhail N Ryazantsev 2,3,a
PMCID: PMC5381632  PMID: 28435665

Version Changes

Revised. Amendments from Version 2

Additional information and data analysis were added in Results section of the article: 1. The comparison of results of different sequence alignment algorithms (new Figure 1 provided); 2. The comparison of the obtained model of archaerhodopsin-3 with the crystallographic structure of archaerhodopsin-1 (new Figure 2, Figure 3); 3. Analysis of the results of absorption maxima calculations for archaerhodopsin-3. Information about analogous results for other rhodopsins is provided. 4. Residues replaced in site-directed mutagenesis study (Mclsaac RS et al,  PNAS, 2014) were visualized (new Figure 4).   Modifications made in the Introduction section and Abstract, considering the remarks of our referees. In the Methods section information about sequence identity between archaerhodopsin-1 and archaerhodopsin-3 is provided. Also, the new variant of the archieve with input and output files, extra grant information (Russian Foundation for Basic Research and Presidium of the RAS) and acknowledgements to two computational research facilities (HPC computing resources at Lomonosov Moscow State University and Computer Center of SPbU) are provided. The additional grants listed, have aided in the continuation of the project that was supported by previous funding.

Abstract

It was demonstrated in recent studies that some rhodopsins can be used in optogenetics as fluorescent indicators of membrane voltage. One of the promising candidates for these applications is archaerhodopsin-3. While it has already shown encouraging results, there is still a large room for improvement. One of possible directions is increasing the intensity of the protein's fluorescent signal. Rational design of mutants with an improved signal is an important task, which requires both experimental and theoretical studies. Herein, we used a homology-based computational approach to predict the three-dimensional structure of archaerhodopsin-3, and a Quantum Mechanics/Molecular Mechanics (QM/MM) hybrid approach with high-level multireference ab initio methodology (SORCI+Q/AMBER) to model optical properties of this protein. We demonstrated that this methodology allows for reliable prediction of structure and spectral properties of archaerhodopsin-3. The results of this study can be utilized for computational molecular design of efficient fluorescent indicators of membrane voltage for modern optogenetics on the basis of archaerhodopsin-3.

Keywords: optogenetics, archaerhodopsin, protein structure prediction, QM/MM, spectral tuning in rhodopsins

Introduction

Precise and quick control of physiological processes using integrated optical and genetic methods is a vast area with a high number of important applications 1. One possible approach in this field is using fluorescent voltage-dependent indicators for detecting the activity of mammalian neurons, which allows achievement of the precision of a single neuron without perceptible time delays. It was recently shown that some rhodopsins, especially achaerhodopsin-3, can be potential candidates for such a task 25. While the results obtained for archaerhodopsin-3 are already very encouraging, increasing the fluorescent signal of such proteins can lead to a significant progress in this field. It was also shown that the insertion of mutations into these proteins can dramatically improve the signal quality 25.

Unfortunately, the fundamental mechanisms underlying the processes that determine fluorescence are not well understood. This lack of knowledge leads to difficulties with design of desired rhodopsin mutants. While rational design is not based on a solid foundation and, for this reason, is not very effective, another experimental approach, random mutagenesis, is very time consuming. Computational studies can provide additional insights into the problem. One of the main obstacles for computational modeling of proteins is the absence of three-dimensional structures of high quality, especially for membrane proteins, which are a challenge for crystallization. On the other hand, computational prediction of three-dimensional structures is not trivial. The goal of this study was to obtain a good-quality structure for achaerhodopsin-3, one of the most used voltage-dependent fluorescent sensors 4, 5, and based on this structure to predict the optical properties of this protein.

To achieve this goal, we used a homology-based computational approach for structure prediction. As the choice of a structure prediction algorithm is not straightforward, we tested several methods. To evaluate the quality of obtained structures we performed subsequent Quantum Mechanics/Molecular Mechanics (QM/MM) calculations of absorption maxima and compared the results with available experimental data.

Methods

The structure of archaerhodopsin-3 was built using a homology modeling approach. Primary structures for all rhodopsins with crystallographic data are available in the Protein Data Bank library 6 (24 structures as of September 2016) were compared with the primary structure of archaerhodopsin-3. Archaerhodopsin-1, which has the highest sequence identity to the target protein, was chosen as a template (RCSB code 1UAZ, sequence identity 84.5%, sequence similarity 91.5%). Three algorithms of homology-based model building were tested: Medeller 7, I-TASSER 8 and RosettaCM 9. All methods of homology modeling heavily rely on externally made target-template alignment of primary sequences, which serves as the main instruction for model building. For this reason, we tested three algorithms of pairwise alignment using their results as an input for each method of model building. Two of the alignment methods are specifically constructed for membrane proteins, MP-T 10 and AlignMe 11, and the third one, MUSTER 12, gains its quality from evolutionary predictions. The latter algorithm is a built-in algorithm of I-TASSER suite and its results were used only for this method of structure prediction.

Before QM/MM calculations, several preparation steps were performed: hydrogen atoms were added using pdb2pqr package 13 version 2.1.1 using CHARMM force field version 27 14, pH=7; hydrogen atoms were equilibrated by energy minimization in NAMD package 15, version 2.11. The retinal chromophore was bound to the lysine residue Lys226, whole lysine + retinal system was parameterized in CHARMM force field 16. The protein was inserted in the POPC membrane 17, the whole system was inserted in a water solvent box, the TIP3P water model 18 was used, the size of water box was selected so that there were at least 10 Å from any atom of protein to the edge of the system, and the system was neutralized by addition of Na + and Cl - ions.

Relaxation of the system was performed in several steps: relaxation of retinal + lysine complex with all other atoms fixed, relaxation of all atoms that were within 6 Å of the chromophore system, relaxation of whole protein and water box. During all these steps the following parameters were used: a 10 Å cutoff with switching starting at 8.5 Å was applied to the electrostatics and van der Waals interactions; Particle Mesh Ewald method 19 was used for dealing with electrostatics interactions, grid spacing 1Å. Equilibrated protein structure was extracted; internal waters were added into protein cavities using WaterDock program 20.

To calculate absorption maxima, we used the methodology that has been proven as efficient in a number of our previous studies for different kind of rhodopsins and rhodopsin mimics 2127. The structures of the archaerhodopsin-3 obtained at the previous step were optimized using two-layer ONIOM (QM:MM-EE) scheme. (QM=B3LYP/6-31G*; MM= AMBER for aminoacids and TIP3P for water, EE=electronic embedding) was implemented in the Gaussian09 package 28. To calculate the spectral properties of the chromophore in the presence of the protein environment (described as AMBER point charges) SORCI+Q/6-31G* level of the theory was used, as it is implemented in ORCA6.0 package 29. For details of previously performed QM/MM methodology see Altun et al. 30, 31.

Results

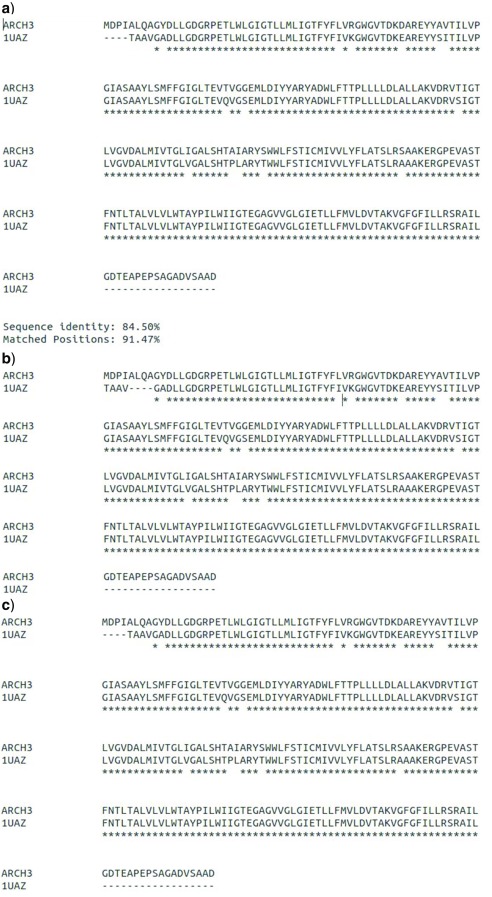
On the first step of structure prediction of archaerhodopsin-3 we performed the alignment of its amino acid sequence with the sequence of archaerhodopsin-1, comparing three different algorithms: AlignMe, MUSTER and MP-T. The results of AlignMe and MUSTER algorithms were identical; they differ from the MP-T alignment result in the flexible N-terminal part ( Figure 1, a–c).

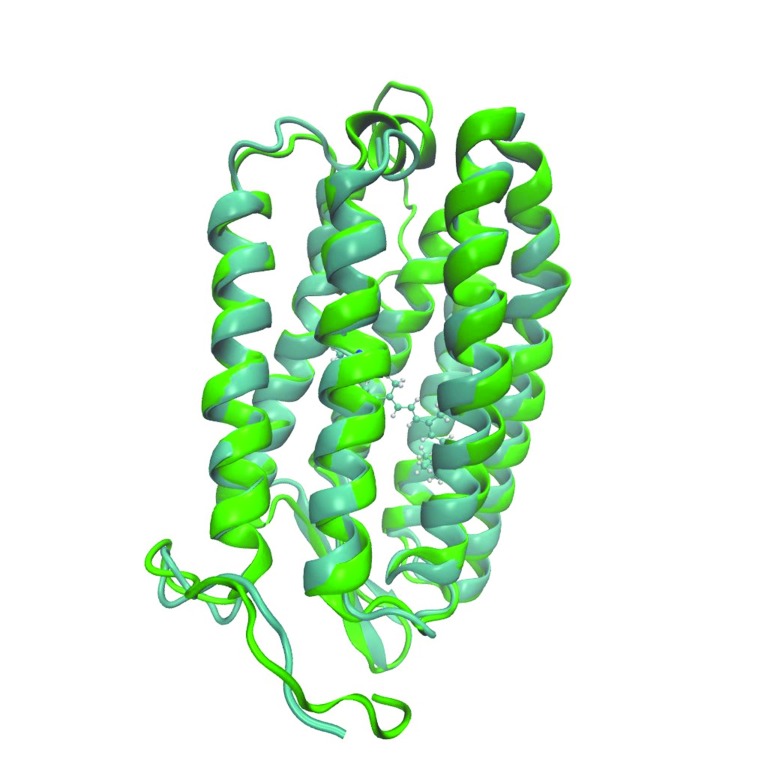
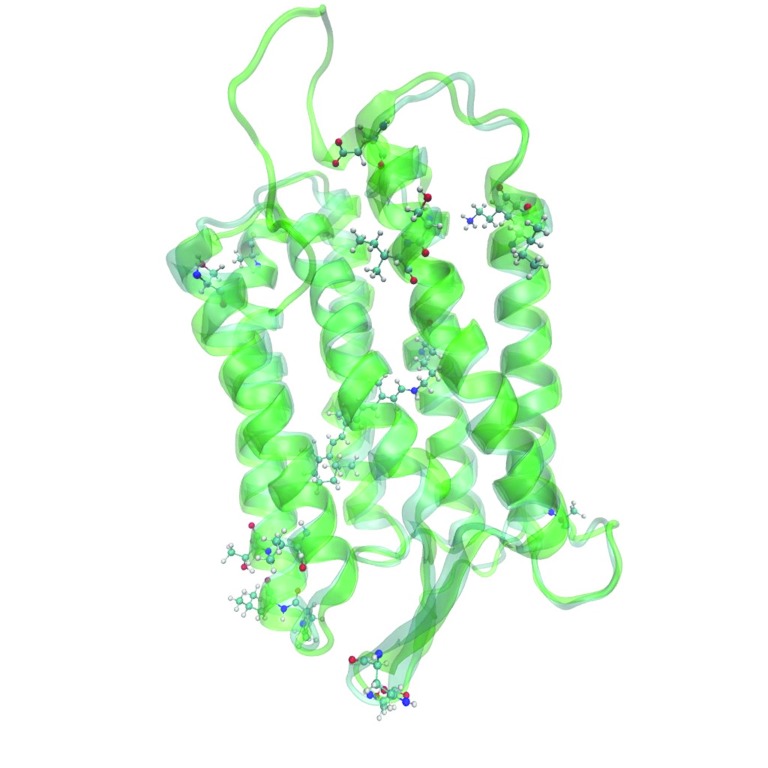
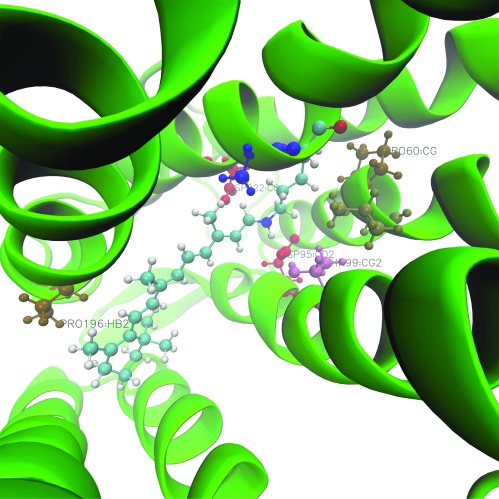
On the next step we built 7 three-dimensional models of archaerhodopsin-3 using I-TASSER, Medeller and RosettaCM algorithms of template-based structure prediction. Comparison of crystallographic structure of archaerhodopsin-1 with the predicted structure of archaerhodopsin-3 showed that these two proteins differ only in loop regions and on the edges of the alpha-helices ( Figure 2, Figure 3). These regions are located on relatively large distance from the retinal chromophore. We also highlighted the residues, which were the sites for the site-directed mutagenesis of the archaerhodopsin-3 5 ( Figure 4). The computational characterization of these mutants is an interesting problem for further investigations.

For all seven predicted models we calculated the absorption maximum wavelengths. All obtained models provide reasonable results -- the deviation range is only 31 nm from the experiment ( Table 1). This deviation range is sensible considering the approximations used in our methodologies. In our previous studies, we obtained a 29 nm shift for the absorption maximum of halorhodopsin from N.pharaonis 23, a 25 nm shift for the absorption maximum of archaerhodopsin-2 and a 39 nm shift for the channelrhodopsin-2. The model with the smallest deviation was predicted by I-TASSER algorithm with AlignMe alignment ( Figure 2).

Figure 1.

Figure 1.

The results of the pairwise sequence alignment algorithms: a) AlignMe; b) MP-T; c) MUSTER.

Figure 2. The predicted structure of archaerhodopsin-3 (green) superimposed on crystallographic structure of archaerhodopsin-1 (blue).

Figure 2.

Figure 3. The illustration of the differences between structures of archaerhodopsin-1 and archaerhodopsin-3.

Figure 3.

Figure 4. The visualization of residues, which were replaced in the site-directed mutagenesis study of archaerhodopsin-3 5.

Figure 4.

Table 1. Absorption spectrum maximum of achaerhodopsin-3 for different models.

Alignment
method
Model building method λ max, nm
-- Experimental wild-type structure 556
AlignMe I-TASSER 578
MP-T I-TASSER 581
MUSTER I-TASSER 581
AlignMe RosettaCM 587
MP-T RosettaCM 585
AlignMe Medeller 580
MP-T Medeller 586

Conclusions

In this study, we predicted the structure of fluorescent voltage-dependent sensor achaerhodopsin-3 and evaluated its quality with subsequent QM/MM high level ab initio calculations of spectral properties. The calculated absorption maximum is within 31 nm from the experimental value. Several methods of model building were tested and spectral characteristics were calculated for all resulting models. We showed that our methodology allowed for reliable prediction of optical properties of archaerhodopsin-3. The results of this study can be utilized for high-level QM/MM investigation of different aspects of photochemistry of this voltage-dependent fluorescent sensor and, therefore, to contribute in development of the efficient molecular tools for modern optogenetics.

Data availability

The data referenced by this article are under copyright with the following copyright statement: Copyright: © 2017 Nikolaev DM et al.

The sequence of archaerhodopsin-3 was taken from Uniprot database: http://www.uniprot.org/uniprot/P96787

The template for homology modeling was taken from PDB database (rcsb code 1UAZ): http://www.rcsb.org/pdb/explore/explore.do?structureId=1UAZ

The input files of I-TASSER suite, RosettaCM, Medeller algorithms with corresponding README files, zipped output of I-TASSER suite, scripts for processing structure after homology modeling stage (with instructions in README file), input files for spectra calculations are available: doi, https://doi.org/10.5281/zenodo.830025 32.

Acknowledgements

The research is carried out using the equipment of the shared research facilities of HPC computing resources at Lomonosov Moscow State University.

Research was carried out using computational resources provided by Resource Center “Computer Center of SPbU” ( http://cc.spbu.ru).

Funding Statement

MNR were supported by Russian Foundation for Basic Research (grant numbers, 14-04-01339 A, 15-29-03872 ofi_m and 16-04-00494 A). The work was funded by Ministry of Education and Science of Russian Federation (grant 16.9790.2017/BCh). The work was funded by a grant from the Presidium of the Russian Academy of Sciences.

[version 3; referees: 3 approved]

References

  • 1. Deisseroth K: Optogenetics. Nat Methods. 2011;8(1):26–29. 10.1038/nmeth.f.324 [DOI] [PMC free article] [PubMed] [Google Scholar]
  • 2. Engqvist MK, Mclsaac RS, Dollinger P, et al. : Directed evolution of Gloeobacter violaceus rhodopsin spectral properties. J Mol Biol. 2015;427(1):205–220. 10.1016/j.jmb.2014.06.015 [DOI] [PubMed] [Google Scholar]
  • 3. Kralj JM, Hochbaum DR, Douglass AD, et al. : Electrical spiking in Escherichia coli probed with a fluorescent voltage-indicating protein. Science. 2011;333(6040):345–348. 10.1126/science.1204763 [DOI] [PubMed] [Google Scholar]
  • 4. Kralj JM, Douglass AD, Hochbaum DR, et al. : Optical recording of action potentials in mammalian neurons using a microbial rhodopsin. Nat Methods. 2012;9(1):90–95. 10.1038/nmeth.1782 [DOI] [PMC free article] [PubMed] [Google Scholar]
  • 5. Mclsaac RS, Engqvist MK, Wannier T, et al. : Directed evolution of a far-red fluorescent rhodopsin. Proc Natl Acad Sci U S A. 2014;111(36):13034–13039. 10.1073/pnas.1413987111 [DOI] [PMC free article] [PubMed] [Google Scholar]
  • 6. Westbrook J, Feng Z, Chen L, et al. : The Protein Data Bank and structural genomics. Nucleic Acids Res. 2003;31(1):489–491. 10.1093/nar/gkg068 [DOI] [PMC free article] [PubMed] [Google Scholar]
  • 7. Kelm S, Shi J, Deane CM: MEDELLER: homology-based coordinate generation for membrane proteins. Bioinformatics. 2010;26(22):2833–2840. 10.1093/bioinformatics/btq554 [DOI] [PMC free article] [PubMed] [Google Scholar]
  • 8. Yang J, Yan R, Roy A, et al. : The I-TASSER Suite: protein structure and function prediction. Nat Methods. 2015;12(1):7–8. 10.1038/nmeth.3213 [DOI] [PMC free article] [PubMed] [Google Scholar]
  • 9. Song Y, DiMaio F, Wang RY, et al. : High-resolution comparative modeling with RosettaCM. Structure. 2013;21(10):1735–1742. 10.1016/j.str.2013.08.005 [DOI] [PMC free article] [PubMed] [Google Scholar]
  • 10. Hill JR, Deane CM: MP-T: improving membrane protein alignment for structure prediction. Bioinformatics. 2013;29(1):54–61. 10.1093/bioinformatics/bts640 [DOI] [PubMed] [Google Scholar]
  • 11. Stamm M, Staritzbichler R, Khafizov K, et al. : AlignMe--a membrane protein sequence alignment web server. Nucleic Acids Res. 2014;42(Web Server issue):W246–W251. 10.1093/nar/gku291 [DOI] [PMC free article] [PubMed] [Google Scholar]
  • 12. Wu S, Zhang Y: MUSTER: Improving protein sequence profile-profile alignments by using multiple sources of structure information. Proteins. 2008;72(2):547–556. 10.1002/prot.21945 [DOI] [PMC free article] [PubMed] [Google Scholar]
  • 13. Dolinsky TJ, Nielsen JE, McCammon JA, et al. : PDB2PQR: an automated pipeline for the setup of Poisson-Boltzmann electrostatics calculations. Nucleic Acids Res. 2004;32(Web Server issue):W665–W667. 10.1093/nar/gkh381 [DOI] [PMC free article] [PubMed] [Google Scholar]
  • 14. Best RB, Zhu X, Shim J, et al. : Optimization of the additive CHARMM all-atom protein force field targeting improved sampling of the backbone φ, ψ and side-chain χ 1 and χ 2 dihedral angles. J Chem Theory Comput. 2012;8(9):3257–3273. 10.1021/ct300400x [DOI] [PMC free article] [PubMed] [Google Scholar]
  • 15. Phillips JC, Braun R, Wang W, et al. : Scalable molecular dynamics with NAMD. J Comput Chem. 2005;26(16):1781–1802. 10.1002/jcc.20289 [DOI] [PMC free article] [PubMed] [Google Scholar]
  • 16. Zhu S, Brown MF, Feller SE: Retinal conformation governs p K a of protonated Schiff base in rhodopsin activation. J Am Chem Soc. 2013;135(25):9391–9398. 10.1021/ja4002986 [DOI] [PMC free article] [PubMed] [Google Scholar]
  • 17. Klauda JF, Venable RM, Freites JA, et al. : Update of the CHARMM all-atom additive force field for lipids: validation on six lipid types. J Phys Chem B. 2010;114(23):7830–7843. 10.1021/jp101759q [DOI] [PMC free article] [PubMed] [Google Scholar]
  • 18. MacKerrel AD, Bashford D, Bellot M, et al. : All-atom emperical potential for molecular modeling and dynamics studies of proteins. J Phys Chem B. 1998;102(18):3586–3616. 10.1021/jp973084f [DOI] [PubMed] [Google Scholar]
  • 19. Darden TA, York D, Pedersen LG: Particle mesh Ewald: an N-log( N) method for Ewald sums in large systems. J Chem Phys. 1993;98(12):10089–10092. 10.1063/1.464397 [DOI] [Google Scholar]
  • 20. Ross GA, Morris GM, Biggin PC, et al. : Rapid and accurate prediction and scoring of water molecules in protein binding sites. PLoS One. 2012;7(3):e32036. 10.1371/journal.pone.0032036 [DOI] [PMC free article] [PubMed] [Google Scholar]
  • 21. Altun A, Morokuma K, Yokoyama S: H-bond network around retinal regulates the evolution of ultraviolet and violet vision. ACS Chem Biol. 2011;6(8):775–780. 10.1021/cb200100f [DOI] [PMC free article] [PubMed] [Google Scholar]
  • 22. Melloni A, Rossi Paccani R, Donati D, et al. : Modeling, preparation, and characterization of a dipole moment switch driven by Z/E photoisomerization. J Am Chem Soc. 2010;132(27):9310–9319. 10.1021/ja906733q [DOI] [PubMed] [Google Scholar]
  • 23. Ryazantsev MN, Altun A, Morokuma K: Color tuning in rhodopsins: the origin of the spectral shift between the chloride-bound and anion-free forms of halorhodopsin. J Am Chem Soc. 2012;134(12):5520–5523. 10.1021/ja3009117 [DOI] [PMC free article] [PubMed] [Google Scholar]
  • 24. Sinicropi A, Martin E, Ryazantsev M, et al. : An artificial molecular switch that mimics the visual pigment and completes its photocycle in picoseconds. Proc Natl Acad Sci U S A. 2008;105(46):17642–17647. 10.1073/pnas.0802376105 [DOI] [PMC free article] [PubMed] [Google Scholar]
  • 25. Shapiro I, Ryazantsev MN, Ding WJ, et al. : Computational photobiology and beyond. Aust J Chem. 2010;63(3):413–429. 10.1071/CH09563 [DOI] [Google Scholar]
  • 26. Schapiro I, Ryazantsev MN, Frutos LM, et al. : The ultrafast photoisomerizations of rhodopsin and bathorhodopsin are modulated by bond length alternation and HOOP driven electronic effects. J Am Chem Soc. 2011;133(10):3354–3364. 10.1021/ja1056196 [DOI] [PubMed] [Google Scholar]
  • 27. Sumita M, Ryazantsev MN, Saito K: Acceleration of the Z to E photoisomerization of penta-2,4-dieniminium by hydrogen out-of-plane motion: theoretical study on a model system of retinal protonated Schiff base. Phys Chem Chem Phys. 2009;11(30):6406–6414. 10.1039/b900882a [DOI] [PubMed] [Google Scholar]
  • 28. Frisch MJ, Trucks GW, Shelegel HB, et al. : gaussian 09. Gaussian, Inc., Wallingford, CT 4,2009. Reference Source [Google Scholar]
  • 29. Neese FJ: A spectroscopy oriented configuration interaction procedure. J Chem Phys. 2003;119(18):9428–9443. 10.1063/1.1615956 [DOI] [Google Scholar]
  • 30. Altun A, Yokoyama S, Morokuma K: Spectral tuning in visual pigments: an ONIOM(QM:MM) study on bovine rhodopsin and its mutants. J Phys Chem B. 2008;112(22):6814–6827. 10.1021/jp709730b [DOI] [PMC free article] [PubMed] [Google Scholar]
  • 31. Altun A, Yokoyama S, Morokuma K: Mechanism of spectral tuning going from retinal in vacuo to bovine rhodopsin and its mutants: multireference ab initio quantum mechanics/molecular mechanics studies. J Phys Chem B. 2008;112(51):16883–16890. 10.1021/jp807172h [DOI] [PMC free article] [PubMed] [Google Scholar]
  • 32. Nikolaev DM, Emelyanov A, Boitsov VM, et al. : Supplementary information for: “A voltage-dependent fluorescent indicator for optogenetic applications, archaerhodopsin-3: Structure and optical properties from in silico modeling” [Data set]. Zenodo. 2017. Data Source [DOI] [PMC free article] [PubMed] [Google Scholar]
F1000Res. 2017 Nov 22. doi: 10.5256/f1000research.14321.r28011

Referee response for version 3

Jeremy N Harvey 1

I am satisfied by the authors' responses.

I have read this submission. I believe that I have an appropriate level of expertise to confirm that it is of an acceptable scientific standard.

F1000Res. 2017 Nov 22. doi: 10.5256/f1000research.14321.r28010

Referee response for version 3

Adam E Cohen 1

The authors have improved the manuscript in response to the comments from the other referees and me.

I have read this submission. I believe that I have an appropriate level of expertise to confirm that it is of an acceptable scientific standard.

F1000Res. 2017 Mar 31. doi: 10.5256/f1000research.11514.r20540

Referee response for version 2

Jeremy N Harvey 1

The very short manuscript reports homology modelling of the membrane protein, coupled with 'validation' by using vertical excitation energies computed with a QM/MM protocol. I think the work is interesting, particularly since the authors have made their data available, making it easier to others to build upon it. However, I have a number of concerns, many of which could be addressed simply by describing the results and their implications in a bit more detail.

  1. The first set of comments (1)-(3) in Cohen & Farhi's report seem important to me. I think that in the paper, the authors use the position of the absorption peak to judge the validity of their structural model. So the precise mechanism of fluorescence does not matter, nor does proton transfer, nor does the fluorescence quantum yield. Rather these are ideas for future work. But it would do no harm to spell these things out a bit more.

  2. There is *very* little in the results section: 1 Figure, 1 Table, and 4 lines of text. Why not tell us a bit more? For example, the authors generate a homology model, but apart from showing us a cartoon structural picture of it, they don't say anything about it. How good was the sequence alignment? How long are the various helices? How well does this compare to various other transmembrane proteins of this type? How much did the other homology models differ from the preferred one, and from each other? Without this kind of analysis, this paper really just consists of a set of input and output files of homology modelling/sequence alignment.

  3. Still in the results section, the authors use SORCI+Q QM/MM vertical excitation energies computed at optimized structures to assess the quality of the homology models. This seems extremely naive to me. The different models return vertical excitation energies that differ by just over 1%, and are about 4% from experiment. I really don't think that this is a good basis for deciding that one of them is better than the others. There are just too many sources of error for making this a meaningful comparison. On the one hand, SORCI+Q with the basis set used will potentially have an error of several tenths of an eV. 0.2 eV is 10% of the excitation energy based on the experimental spectrum. Furthermore, the authors have computed just one vertical excitation energy for each model, at a structure derived by a rather minimal geometry optimization ('relaxation') protocol. The FWHM of the UV/Vis absorption peak of bacetriorhodopsin appears to be about 100nm, i.e. 15% of the band centre. I assume roughly the same is true here. In principle, even accepting that the starting point homology model is correct, and the SORCI Hamiltonian is exact, the QM/MM protocol used could return a vertical excitation energy 50 nm or so either side of the experimental peak. This just makes the criterion meaningless. There are other criteria for assessing the internal consistency of homology models.

As I understand it, the philosophy of F1000Research is that papers can be published if they have some interest, and I think some people might find the homology modelling interesting, and the detailed structural models with the chromophore. So I'm happy for this to be indexed. But I think the QM/MM calculations are hugely over-interpreted, and recommend the authors consider revising this section, as well as adding some of the discussion I mention above.

I have read this submission. I believe that I have an appropriate level of expertise to confirm that it is of an acceptable scientific standard, however I have significant reservations, as outlined above.

F1000Res. 2017 Nov 10.
Mikhail N Ryazantsev 1

Dear Prof. Harvey,

Thank you for your review of our article “A voltage-dependent fluorescent indicator for optogenetic applications, archaerhodopsin-3: Structure and optical properties from  in silico modeling”. We have carefully read it and made several changes of the article, considering your notices. We attach the new version of the article in this email.

1. “ There is *very* little in the results section: 1 Figure, 1 Table, and 4 lines of text. Why not tell us a bit more? For example, the authors generate a homology model, but apart from showing us a cartoon structural picture of it, they don't say anything about it. How good was the sequence alignment? How long are the various helices? How well does this compare to various other transmembrane proteins of this type? How much did the other homology models differ from the preferred one, and from each other? Without this kind of analysis, this paper really just consists of a set of input and output files of homology modelling/sequence alignment.”

Considering this remark, we edited the results section of our article. The sequence identity between Arch-1 and Arch-3 is 84.5%, sequence similarity is 91.5% (based on the AlignMe alignment of these sequences). We added this information in the “Methods” section of our article.

We also compared the results of the sequence alignment algorithms. The comparison showed that all three of them are very similar: AlignMe and MUSTER gave identical results with small difference from the MP-T alignment in the beginning of the sequence (Figure 1 in the article). We added the following text in the “Results” section of our article:

 “On the first step of structure prediction of archaerhodopsin-3 we performed the alignment of its amino acid sequence with the sequence of archaerhodopsin-1, comparing three different algorithms: AlignMe, MUSTER and MP-T. The results of AlignMe and MUSTER algorithms were identical; they differ from the MP-T alignment result in the flexible N-terminal part (Figure 1, a-c).”

We also compared the crystallographic structure of archaerhodopsin-1 and the predicted model of archaerhodopsin-3 (Figure 2, 3 in the article). We showed that the structures of two proteins are very similar, and they differ only in loop regions and on the edges of alpha-helices, i.e. in the regions located quite far from the chromophore. We added the following text in the “Results” section of our article:

“Comparison of crystallographic structure of archaerhodopsin-1 with the predicted structure of archaerhodopsin-3 showed that these two proteins differ only in loop regions and on the edges of the alpha-helices (Figure 2, 3). These regions are located on relatively large distance from the retinal chromophore.”

2. “Still in the results section, the authors use SORCI+Q QM/MM vertical excitation energies computed at optimized structures to assess the quality of the homology models. This seems extremely naive to me. The different models return vertical excitation energies that differ by just over 1%, and are about 4% from experiment. I really don't think that this is a good basis for deciding that one of them is better than the others. There are just too many sources of error for making this a meaningful comparison. On the one hand, SORCI+Q with the basis set used will potentially have an error of several tenths of an eV. 0.2 eV is 10% of the excitation energy based on the experimental spectrum. Furthermore, the authors have computed just one vertical excitation energy for each model, at a structure derived by a rather minimal geometry optimization ('relaxation') protocol. The FWHM of the UV/Vis absorption peak of bacetriorhodopsin appears to be about 100nm, i.e. 15% of the band centre. I assume roughly the same is true here. In principle, even accepting that the starting point homology model is correct, and the SORCI Hamiltonian is exact, the QM/MM protocol used could return a vertical excitation energy 50 nm or so either side of the experimental peak. This just makes the criterion meaningless. There are other criteria for assessing the internal consistency of homology models.”

To refer to these comments, we modified the text. In this case, all models provide reasonable results. However, it is not always the point, and predicted structures can give easily more than 50 nm off experimental values after a relatively small change of three-dimensional structure. In other words, modeling of absorption maxima is very sensitive to the quality of three-dimensional structures.

Considering these remarks, we added the following modifications in the “Results” section:

“All obtained models provide reasonable results – the deviation range is only 31 nm from the experiment (Table 1). This deviation range is sensible considering the approximations used in our methodologies. In our previous studies, we obtained a 29 nm shift for the absorption maximum of halorhodopsin from N.pharaonis, a 25 nm shift for the absorption maximum of archaerhodopsin-2 and a 39 nm shift for the channelrhodopsin-2.”

F1000Res. 2017 Mar 20. doi: 10.5256/f1000research.11514.r20866

Referee response for version 2

Adam E Cohen 1, Samouil Farhi 2

Nikolaev et al. attempt to predict archaerhodopsin-3 structural and optical properties using in silico approaches, layering QM/MM calculations of absorption spectra over homology based structural modeling. As the authors note, such work would be invaluable for guiding the design of new archaerhodopsin variants, with potential broad applicability in the fields of optogenetics and voltage imaging.

The creation of a ground-state homology model is a useful first step, but the authors should acknowledge and discuss some of the challenges that would need to be addressed for this model to be useful in predicting voltage-sensitive fluorescent properties. These are:

  1. The fluorescence of wild-type Arch-3 appears not to come from the ground state, but from a photogenerated intermediate (see 1). Thus a model would need to adopt the correct retinal isomerization state and opsin conformation to reproduce the fluorescence.

  2. To predict voltage sensitivity, a model would need to incorporate the intra-membrane electric field and its influence on the motion of protons within the structure.

  3. The fluorescence quantum yield depends on the branching ration in the electronic excited state between radiative and non-radiative decay pathways. A prediction of quantum yield would need to include simulation of these excited state dynamics.

There are several other ways in which the manuscript could be improved:

  1. The abstract states, “the fluorescent signal for wild-type achaerhodopsin-3 is not strong enough for real applications.” The first paragraph repeats this claim. This is an overly pessimistic view. Many papers have used wild-type Archaerhodopsin 3 (note spelling) and its mutants for fluorescent voltage imaging. A more accurate statement would be, “An increase in the fluorescence of Archaerhodopsin 3 would broaden the scope of its possible applications.”

  2. Arch-1 was used as a homology model for Arch-3.How similar are the two proteins? What percentage sequence identity and sequence homology?

  3. The sole figure shows the best output structure, but doesn’t compare it to anything. It should at least be superimposed with the Arch-1 input structure. The outputs of the different alignment methods should also be compared and any differences highlighted. It would also be useful to have more details on where the Arch-1 and Arch-3 sequences differ - perhaps a linear sequence alignment and a figure showing where differences occur in the 3-D structure.

  4. The authors reference several papers which have performed site-directed mutagenesis on this protein. They should highlight those residues on their output structure. Ideally, they should also perform their AlignMe/I-TASSER analysis on one of the well characterized mutants to show if their model has predictive value.

  5. For scientists unfamiliar with the possibilities of in silico modeling, it is difficult to evaluate whether an 18 nm deviation in absorbance maximum is a lot or a little. It would be helpful to give context using other, previously studied scaffolds. How accurately can the absorbance maximum of eGFP be determined? Of another membrane protein, such as channelrhodopsin-2?

  6. The authors admirably package and make available all of the inputs and outputs of their calculations. Unfortunately, the abstruse organization of the data makes it difficult to extract useful information from their data. The root directory of the supplemental data should include a single clearly written readme.txt file explaining how to access the output structures of each of their homology models. The output files should be obviously labeled - meaning “Figure1structure” not “P96787_wi” - and be in a commonly used file format, such as .pdb.

We have read this submission. We believe that we have an appropriate level of expertise to confirm that it is of an acceptable scientific standard, however we have significant reservations, as outlined above.

References

  • 1. Maclaurin D, Venkatachalam V, Lee H, Cohen AE: Mechanism of voltage-sensitive fluorescence in a microbial rhodopsin. Proc Natl Acad Sci U S A.2013;110(15) : 10.1073/pnas.1215595110 5939-44 10.1073/pnas.1215595110 [DOI] [PMC free article] [PubMed] [Google Scholar]
F1000Res. 2017 Nov 10.
Mikhail N Ryazantsev 1

Dear Prof. Cohen and Samouil Farhi.

Thank you for your review of our article “A voltage-dependent fluorescent indicator for optogenetic applications, archaerhodopsin-3: Structure and optical properties from  in silico modeling”. We have carefully read it and made the required changes in the article.

1. The abstract states, “the fluorescent signal for wild-type achaerhodopsin-3 is not strong enough for real applications.” The first paragraph repeats this claim. This is an overly pessimistic view. Many papers have used wild-type Archaerhodopsin 3 (note spelling) and its mutants for fluorescent voltage imaging. A more accurate statement would be, “An increase in the fluorescence of Archaerhodopsin 3 would broaden the scope of its possible applications.”

To refer to this comment, we added the following changes into the abstract:

“One of the promising candidates for these applications is archaerhodopsin-3. While it has already shown encouraging results, there is still a large room for improvement. One of possible directions is increasing the intensity of the protein's fluorescent signal.”

In the first paragraph we made the similar changes:

“While the results obtained for archaerhodopsin-3 are already very encouraging, increasing the fluorescent signal of such proteins can lead to a significant progress in this field.”

2. “Arch-1 was used as a homology model for Arch-3.How similar is the two proteins? What percentage sequence identity and sequence homology?”

Arch-1 and Arch-3 are very evolutionally close. We added this information in the “Methods” section of the new version of our article: “sequence identity 84.5%, sequence similarity 91.5%”.

3. “The sole figure shows the best output structure, but doesn’t compare it to anything. It should at least be superimposed with the Arch-1 input structure. The outputs of the different alignment methods should also be compared and any differences highlighted. It would also be useful to have more details on where the Arch-1 and Arch-3 sequences differ - perhaps a linear sequence alignment and a figure showing where differences occur in the 3-D structure.”

To refer to this comment, we edited the “Results” section of our article. We added the comparison of outputs of the three alignment methods we used in our work. We showed that the results of AlignMe and MUSTER algorithms are identical, and they only slightly (in the beginning of the sequences) differ from the MP-T alignment results (Figure 1, a-c in the article). We added the following part into our article:

“The results of AlignMe and MUSTER algorithms were identical; they differ from the MP-T alignment result in the flexible N-terminal part (Figure 1, a-c).”

We also compared the crystallographic structure of archaerhodopsin-1 and the predicted model of archaerhodopsin-3 (Figure 2, 3 in the article). We showed that the structures of two proteins are very similar, and they differ only in loop regions and on the edges of alpha-helices, i.e. in the regions located quite far from the chromophore. We added the following text in the “Results” section of our article:

“Comparison of crystallographic structure of archaerhodopsin-1 with the predicted structure of archaerhodopsin-3 showed that these two proteins differ only in loop regions and on the edges of the alpha-helices (Figure 2, 3). These regions are located on relatively large distance from the retinal chromophore.”

4. “ The authors reference several papers which have performed site-directed mutagenesis on this protein. They should highlight those residues on their output structure. Ideally, they should also perform their AlignMe/I-TASSER analysis on one of the well characterized mutants to show if their model has predictive value.”

We highlighted the residues, which were the sites for the site-directed mutagenesis of the archaerhodopsin-3 (Mclsaac RS et al,  PNAS, 2014) (Figure 4 in the article). The computational characterization of mutants is an interesting problem and we will consider it in our research. We hope to publish an article about computational investigation of different mutants of both archaerhodopsin-3 and Gloebacter violaceus rhodopsin.

We added the following text in the “Results” section of our article:

“We also highlighted the residues, which were the sites for the site-directed mutagenesis of the archaerhodopsin-3 5 (Figure 4). The computational characterization of these mutants is an interesting problem for further investigations.”  

5. “For scientists unfamiliar with the possibilities of in silico modeling, it is difficult to evaluate whether an 18 nm deviation in absorbance maximum is a lot or a little. It would be helpful to give context using other, previously studied scaffolds. How accurately can the absorbance maximum of eGFP be determined? Of another membrane protein, such as channelrhodopsin-2?”

In this study, all models provide reasonable results for the values of absorption maxima. Considering the approximations we use in the QM/MM methodologies, the deviation range up to 40 nm is considered to be good; however, in complicated cases we can obtain a 50-60 nm shift from the experimental value. Modeling of the absorption maxima is very sensitive to the quality of three-dimensional structures, and even relatively small changes of the structures can lead to huge shifts of this value.

In the case of the microbial rhodopsins we obtained many results for the absorption maxima of proteins with available crystallographic structure. For example, we obtained a 29 nm shift for halorhodopsin from N. pharaonis, a 25 nm shift for archaerhodopsin-2 and a 39 nm shift for the channelrhodopsin-2. These results lie in the same deviation range, and for this reason we think that the models we obtained have quite high quality. Substantial errors in the models would lead to much bigger shifts (up to 100-200 nm).

Considering these remarks, we added the following modifications in the “Results” section:

“This deviation range is sensible considering the approximations used in our methodologies. In our previous studies, we obtained a 29 nm shift for the absorption maximum of halorhodopsin from N.pharaonis 23, a 25 nm shift for the absorption maximum of archaerhodopsin-2 and a 39 nm shift for the channelrhodopsin-2. The model with the smallest deviation was predicted by I-TASSER algorithm with AlignMe alignment (Figure 2).”

5 . “The authors admirably package and make available all of the inputs and outputs of their calculations. Unfortunately, the abstruse organization of the data makes it difficult to extract useful information from their data. The root directory of the supplemental data should include a single clearly written readme.txt file explaining how to access the output structures of each of their homology models. The output files should be obviously labeled - meaning “Figure1structure” not “P96787_wi” - and be in a commonly used file format, such as .pdb.”

Considering this remark, we created a new version of the archive:

https://zenodo.org/record/830025#.Wcg29Fd2O1E

F1000Res. 2017 Jan 31. doi: 10.5256/f1000research.11514.r19223

Referee response for version 2

Kirill A Afonin 1

Overall the paper by Nikolaev et al., is well written and an interesting part of the photo- and biochemical realm. The paper provides very promising results and a unique way of analyzing structure functionality. I am interested to see what other results arise and the how the applications indicated can be strengthened. I have just a couple of minor suggestions that may help to understand the described subject a bit better.

  • In your abstract please name some examples of real applications.

  • The methodology and computational analysis was a little over my head and difficult to follow. However, the proper audience for this paper may be for those with a stronger foundation of computational analysis and programs indicated in the paper.

  • Archaerhodopsin-1 is misspelled on page 2.

Best wishes to this group and any further work that will be done!

I have read this submission. I believe that I have an appropriate level of expertise to confirm that it is of an acceptable scientific standard.

Associated Data

    This section collects any data citations, data availability statements, or supplementary materials included in this article.

    Data Availability Statement

    The data referenced by this article are under copyright with the following copyright statement: Copyright: © 2017 Nikolaev DM et al.

    The sequence of archaerhodopsin-3 was taken from Uniprot database: http://www.uniprot.org/uniprot/P96787

    The template for homology modeling was taken from PDB database (rcsb code 1UAZ): http://www.rcsb.org/pdb/explore/explore.do?structureId=1UAZ

    The input files of I-TASSER suite, RosettaCM, Medeller algorithms with corresponding README files, zipped output of I-TASSER suite, scripts for processing structure after homology modeling stage (with instructions in README file), input files for spectra calculations are available: doi, https://doi.org/10.5281/zenodo.830025 32.


    Articles from F1000Research are provided here courtesy of F1000 Research Ltd

    RESOURCES