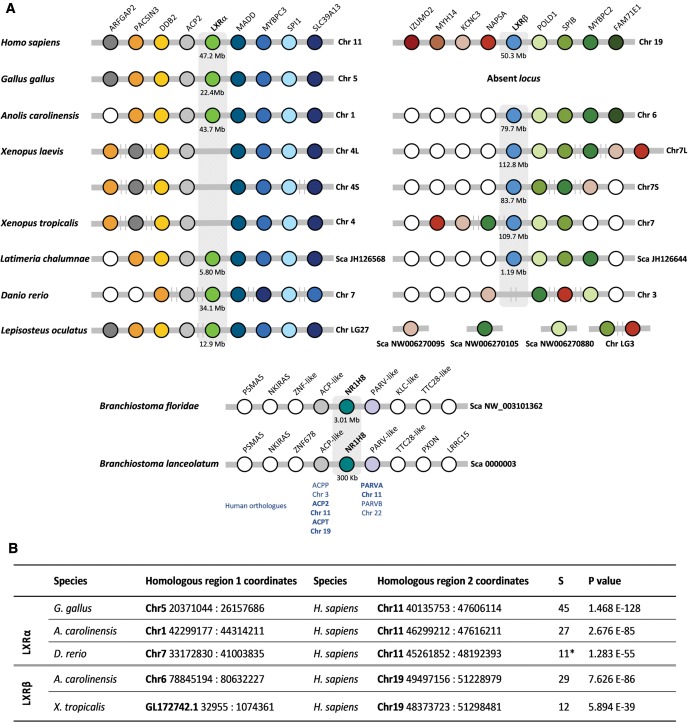
Fig. 2.—
Synteny maps of LXRα and LXRβ loci. (A) Detail of the LXRα locus and LXRβ locus in the selected vertebrate and cephalochordate species; Chr and Sca indicate chromosome and scaffold, respectively. (B) Statistical support of synteny analysis; P values indicate the probability of identifying nonhomologous chromosomal segments, and S indicates the size of the chromosomal segment identified.

